
Acids, Bases, and the pH Scale
Students interpret the logarithmic pH scale, relate hydrogen ion concentration to acidity, and predict the products of simple acid-base neutralization reactions.

Illustrations are auto-generated and may be placeholders. They can be refreshed to match the narration.
Properties of Acids and Bases
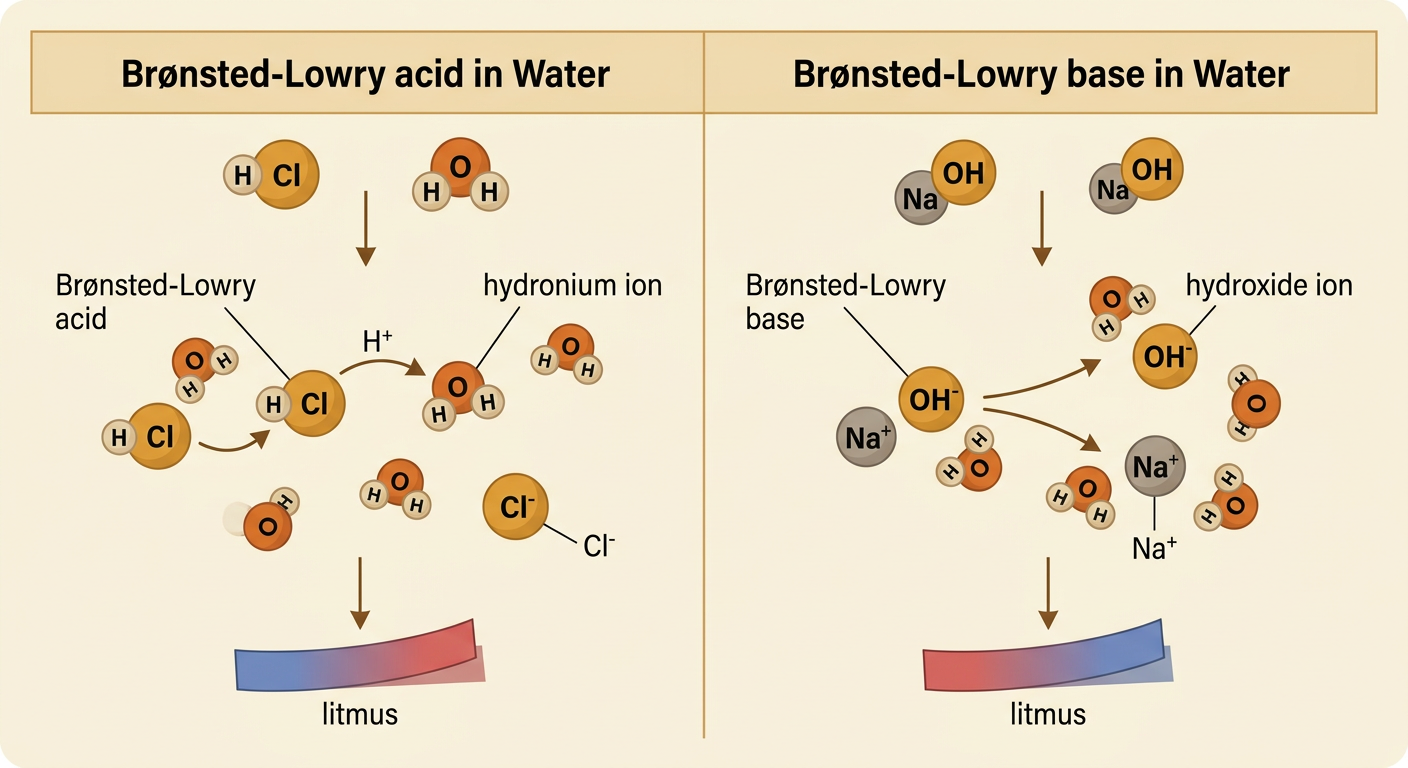
Acids and bases can be identified by how they behave in water and in reactions. A Brønsted-Lowry acid donates a hydrogen ion, H⁺, while a Brønsted-Lowry base accepts H⁺. In water, free H⁺ attaches to water molecules to form hydronium ions, H₃O⁺. Acids often taste sour and turn blue litmus red, but chemicals should never be tasted in a laboratory. Bases often feel slippery and turn red litmus blue. For example, hydrochloric acid transfers H⁺ to water: HCl + H₂O → H₃O⁺ + Cl⁻. Sodium hydroxide separates into Na⁺ and OH⁻ ions in water. Because substances may be hazardous, observations such as indicator color, conductivity, and chemical reactions are safer and more reliable than touch or taste.
Hydrogen Ions and the pH Scale
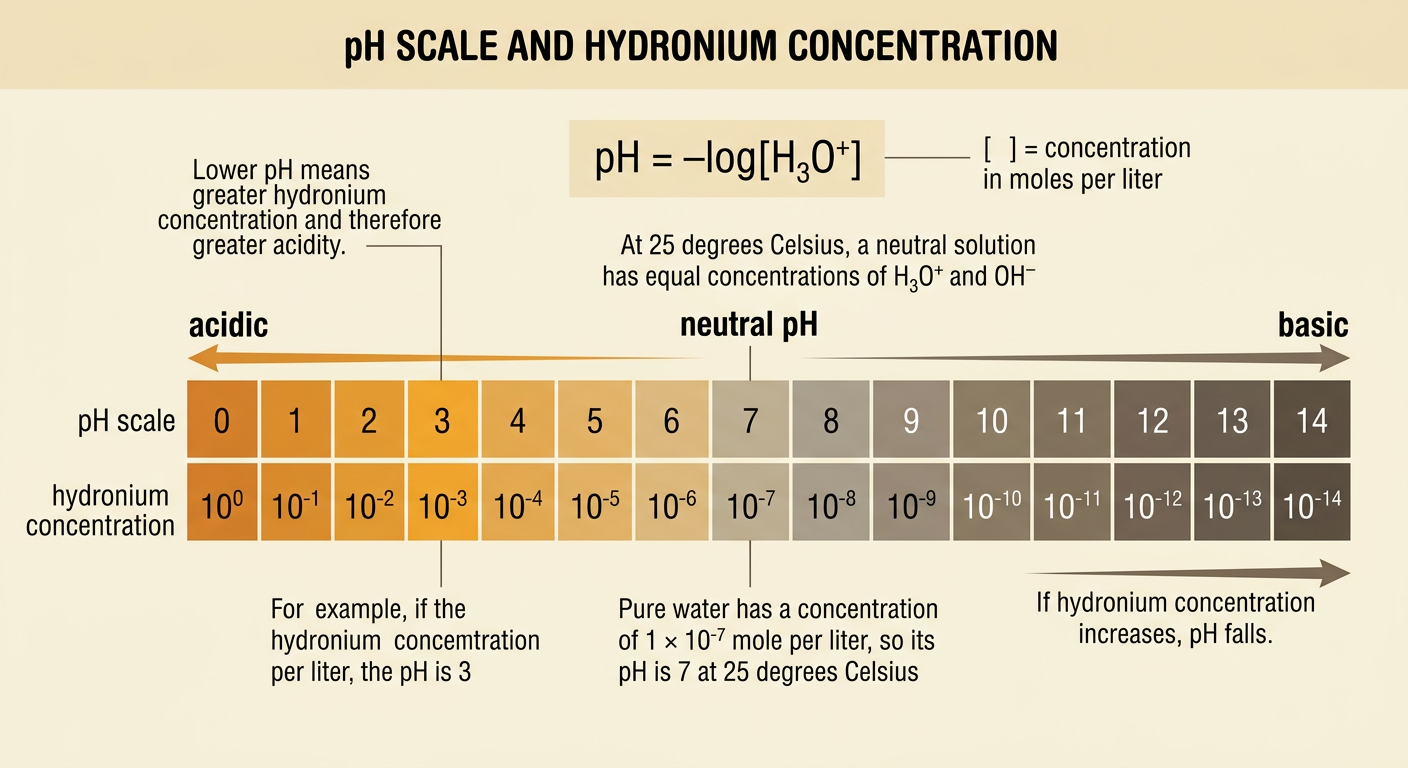
The pH scale describes the hydronium ion concentration of an aqueous solution. It is defined by the equation pH = −log[H₃O⁺], where brackets mean concentration in moles per liter. A lower pH corresponds to a greater hydronium ion concentration and greater acidity. At 25°C, a neutral solution has equal concentrations of H₃O⁺ and OH⁻ and a pH of 7. Solutions below pH 7 are acidic, while solutions above pH 7 are basic. For example, a solution with [H₃O⁺] = 1 × 10⁻³ mole per liter has a pH of 3 because −log(10⁻³) = 3. Pure water has [H₃O⁺] = 1 × 10⁻⁷ mole per liter, giving it a pH of 7 at 25°C.
Interpreting Logarithmic pH Changes
The pH scale is logarithmic, so a change of one pH unit represents a tenfold change in hydronium ion concentration. A solution at pH 4 has ten times as much H₃O⁺ as a solution at pH 5. A difference of two pH units represents a factor of 10², or 100. Therefore, a pH 3 solution has 100 times the hydronium concentration of a pH 5 solution. The relationship can also be reversed using [H₃O⁺] = 10⁻pH. For example, if a lake sample has a pH of 6, its hydronium concentration is 10⁻⁶ mole per liter. If the pH falls to 4, the concentration becomes 10⁻⁴ mole per liter, a 100-fold increase rather than a small two-unit increase.

Indicators and pH Data
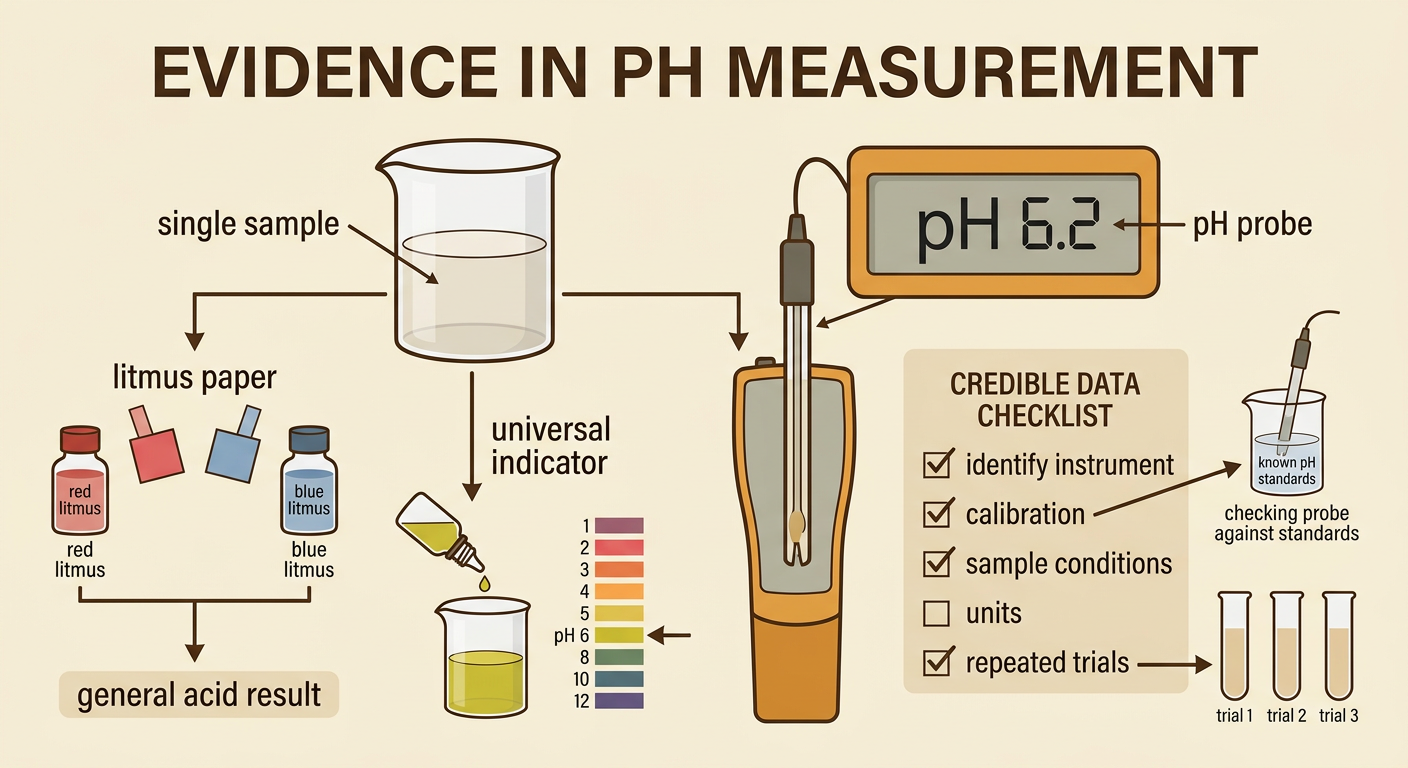
Acid-base indicators are substances that change color over particular pH ranges. Litmus identifies whether a solution is generally acidic or basic, while universal indicator provides a wider range of colors for estimating pH. A calibrated electronic pH probe usually gives more precise numerical data. For example, if universal indicator turns yellow-green in a sample, a color chart may suggest a pH near 6, while a probe might report 6.2. Students can translate these measurements into a graph, table, or position on a pH scale. Data should also be evaluated for credibility. A trustworthy pH result identifies the instrument, calibration method, units, sample conditions, and repeated trials. A claim based on an unlabeled photograph or a single uncalibrated reading provides weaker evidence than documented measurements.
Acid-Base Neutralization
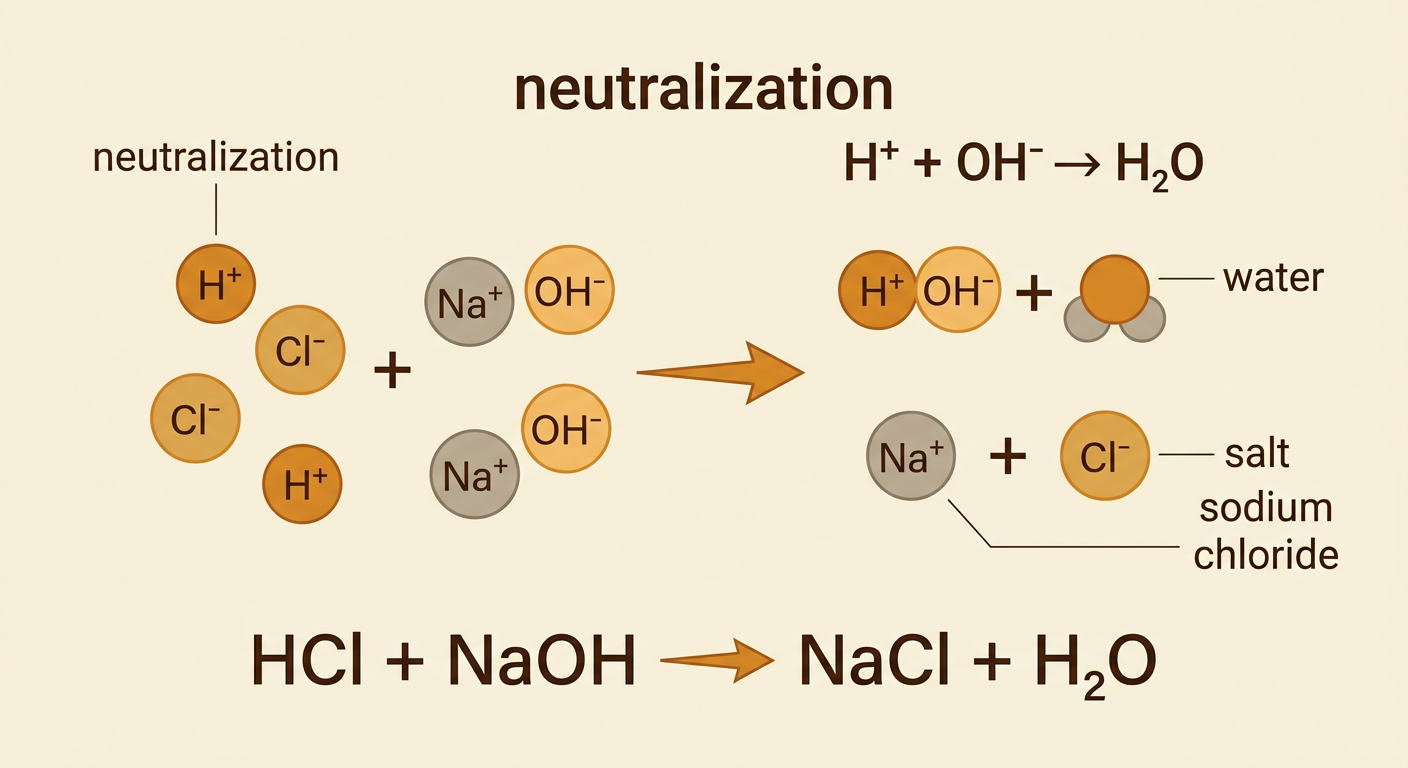
In a neutralization reaction, an acid and a base react to form water and an ionic compound called a salt. The reaction can be predicted by tracking the ions and recognizing that H₃O⁺ and OH⁻ combine to make water. For example, hydrochloric acid reacts with sodium hydroxide according to HCl + NaOH → NaCl + H₂O. The sodium ion and chloride ion remain in solution as sodium chloride. The essential change is represented by the net ionic equation H⁺ + OH⁻ → H₂O. The equation is balanced because the number of each type of atom and the total charge are conserved. Equal reacting amounts of a strong acid and strong base can produce a solution near pH 7, but the final pH depends on acid and base strength, concentration, and amount.
Everyday and Environmental Applications
Acid-base chemistry affects health, industry, agriculture, and ecosystems. Antacid tablets contain bases that neutralize excess stomach acid. For example, calcium carbonate reacts with hydrochloric acid to produce calcium chloride, water, and carbon dioxide: CaCO₃ + 2HCl → CaCl₂ + H₂O + CO₂. Farmers test soil pH because nutrient availability and plant growth depend partly on acidity. Environmental scientists monitor rain, lakes, and oceans because changing pH can affect organisms and chemical cycles. Normal rain is mildly acidic, but pollutants can produce more acidic precipitation. When evaluating an environmental pH claim, students should prefer evidence from government agencies, universities, or studies that explain sampling locations, dates, calibration, and repeated measurements. A graph showing long-term measurements is generally more informative than one isolated reading because it reveals patterns and unusual changes.
