
Acids, Bases, and the pH Scale
Students use indicator evidence and pH data to classify common solutions, compare their acidity, and explain how neutralization can change water quality.

Illustrations are auto-generated and may be placeholders. They can be refreshed to match the narration.
What Makes a Solution Acidic or Basic?
A solution forms when one substance dissolves evenly in another. In water, acids increase the amount of hydrogen ions, often represented as H+, while bases increase hydroxide ions, represented as OH−, or accept hydrogen ions. These particles give acids and bases different properties. For example, vinegar contains acetic acid and is acidic. A baking soda solution is basic. Pure water has balanced amounts of hydrogen and hydroxide ions, so it is neutral. Scientists do not classify a solution by appearance because acidic, basic, and neutral liquids can all look colorless. Instead, they collect evidence from indicators, pH measurements, and reactions. Never taste or touch an unknown solution to identify it. Even solutions with similar pH values can contain different substances and present different hazards.

Reading the pH Scale
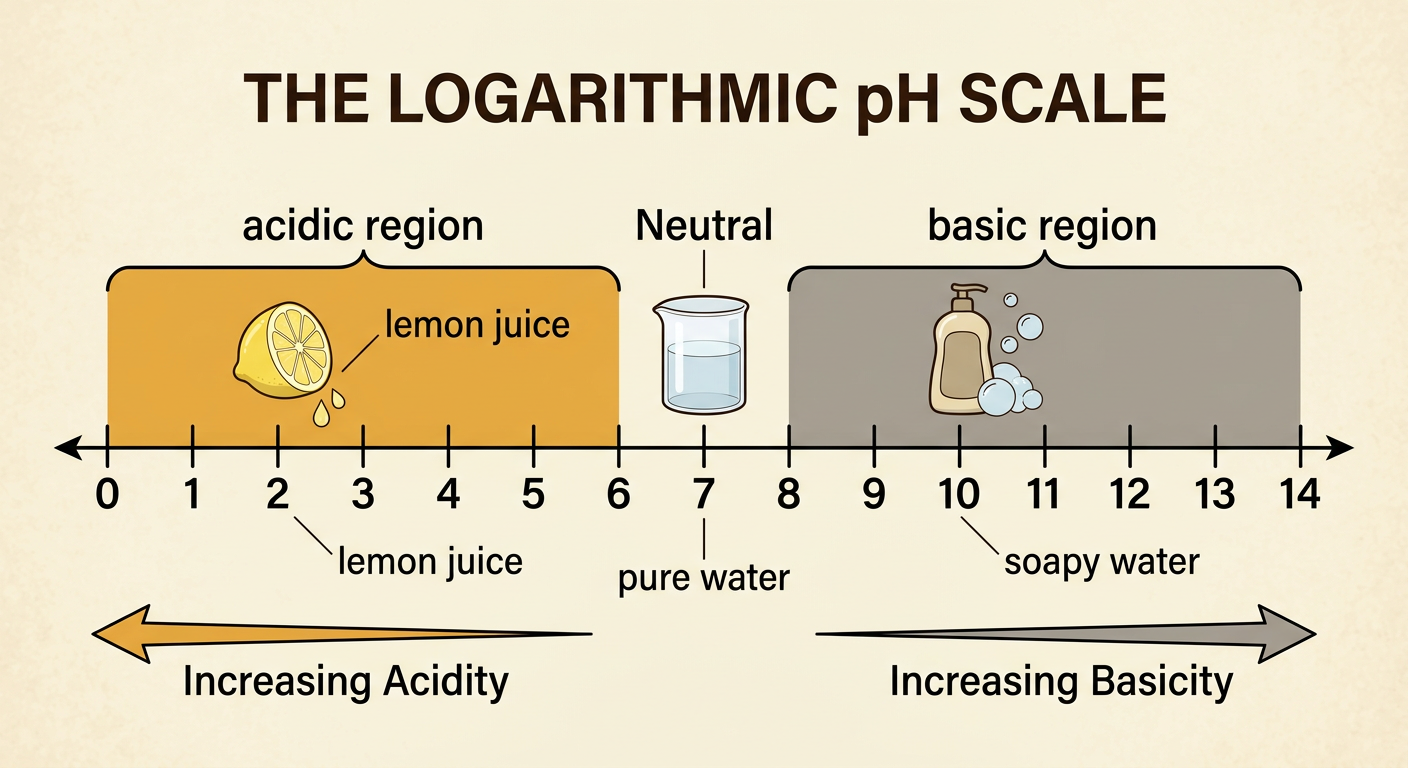
The pH scale describes how acidic or basic a water-based solution is. On the common 0–14 scale, a pH below 7 is acidic, a pH of 7 is neutral, and a pH above 7 is basic. Lower pH values mean greater acidity, while higher values mean greater basicity. The scale is logarithmic, so a solution at pH 3 is ten times as acidic as one at pH 4 and 100 times as acidic as one at pH 5. For example, lemon juice may have a pH near 2, pure water is near 7, and soapy water may have a pH near 10. These are approximate values because concentration, temperature, and ingredients can affect pH. Read measured data rather than assuming every sample of a familiar liquid has exactly the same pH.
Testing Solutions with Indicators
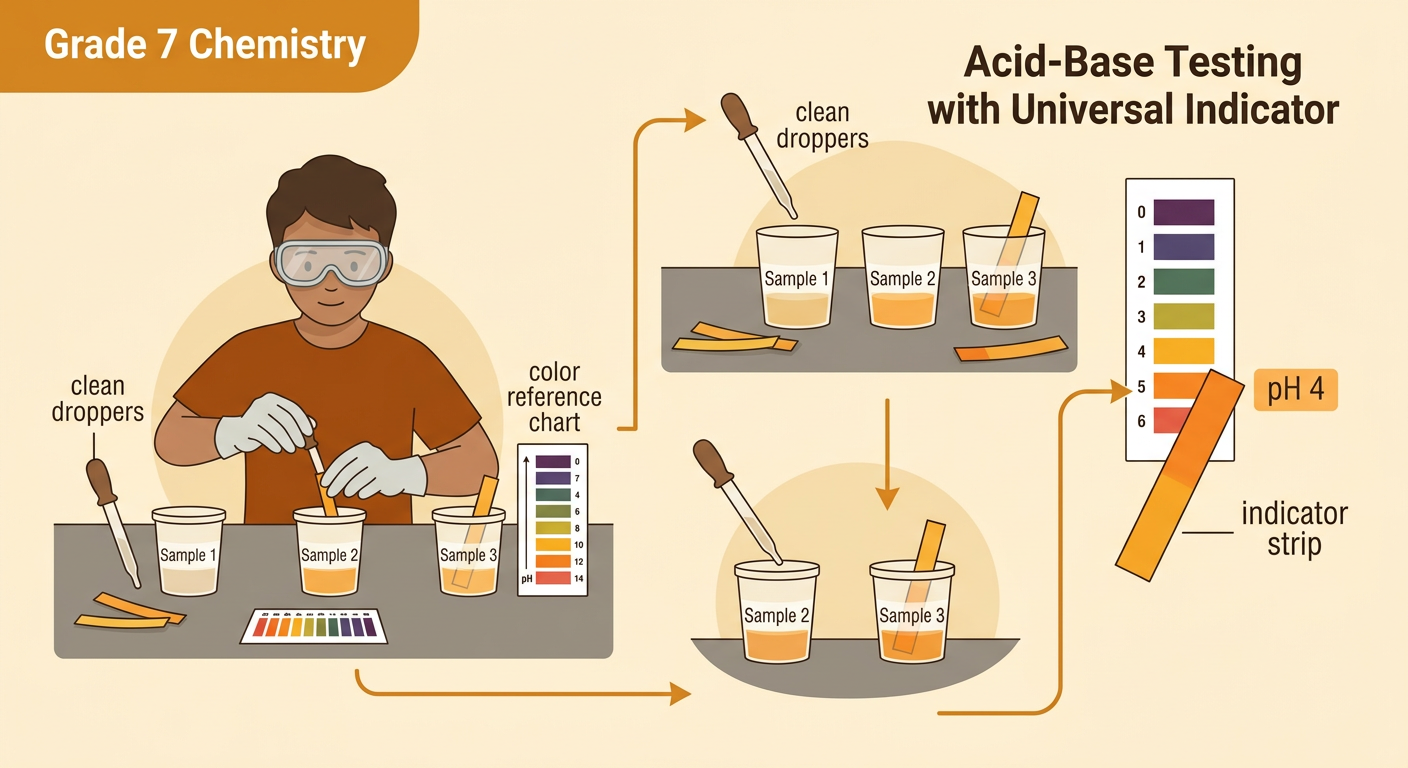
An indicator is a substance that changes color depending on a solution’s pH. Litmus paper gives a broad classification: blue litmus turns red in an acid, while red litmus turns blue in a base. Universal indicator or pH paper provides a wider color range that can be compared with a reference chart to estimate pH. To test samples fairly, label each cup, use the same volume of each solution, place a fresh indicator strip into each sample, wait the stated amount of time, and record the color immediately. Use a clean dropper for every solution to prevent contamination. For example, if an indicator strip turns orange and the chart matches orange with pH 4, the evidence supports classifying the sample as acidic. Indicator results are estimates, so a calibrated pH meter can provide more precise data.
Observing Neutralization
Neutralization occurs when an acid and a base react. Hydrogen ions from the acid combine with hydroxide ions from the base to form water, while other ions usually remain as a dissolved salt. The pH moves toward 7 when suitable amounts are mixed, but the final solution is not always neutral. Excess acid leaves the mixture acidic, and excess base leaves it basic. For example, carefully adding sodium hydroxide solution to hydrochloric acid can produce water and dissolved sodium chloride. Students can measure pH before each addition and after mixing. A pH change, a temperature change, and the formation of new substances together provide evidence that a chemical reaction occurred. Because some neutralization reactions release heat and involve corrosive materials, classroom investigations require goggles, teacher-approved dilute solutions, careful measuring, and no direct contact.

Using pH Evidence to Evaluate Water Quality
pH data can help scientists evaluate water quality, but pH alone cannot show whether water is safe. Most freshwater organisms survive best within a limited pH range, and sudden changes can stress fish, insects, and plants. Suppose students measure a stream at pH 7.2 upstream from a drainage pipe and pH 5.1 downstream. Repeated meter readings support the claim that the downstream water is more acidic. Indicator strips can confirm the general pattern, while observations of fewer aquatic insects provide additional evidence of a possible environmental effect. Each source has limits: a meter may be poorly calibrated, strips give approximate values, and insect numbers can change for reasons besides pH. A strong argument compares repeated measurements, field observations, and reliable water-quality guidelines. If treatment is proposed, controlled neutralization may move pH toward an acceptable range, but scientists must also test for pollutants and avoid adding too much base.
