
Analyzing Acids with Titration Curves
Students interpret acid–base titration data to identify the equivalence point, calculate an unknown concentration, and connect neutralization chemistry to water-quality decisions.

Illustrations are auto-generated and may be placeholders. They can be refreshed to match the narration.
Acids, Bases, and Indicators
An acid donates hydrogen ions, H+, in water, while a base accepts H+ or supplies hydroxide ions, OH−. During neutralization, H+ and OH− combine to form water. An indicator is a substance whose color depends on pH, so it can signal that a titration is near its endpoint. For example, phenolphthalein is colorless in acidic solution and becomes faint pink around pH 8.2 to 10. In a titration, a student might place hydrochloric acid in a flask, add phenolphthalein, and slowly deliver sodium hydroxide from a buret while swirling. The first pale pink color that persists for about 30 seconds marks the indicator endpoint. This observed endpoint estimates the equivalence point, where acid and base have reacted in the exact mole ratio shown by the balanced equation.

Reading a Titration Curve
A titration curve graphs the measured pH against the volume of titrant added. To read it, first identify the initial pH, the gradual-change region, the steep-change region, and the final leveling region. Suppose 0.100 M sodium hydroxide is added to hydrochloric acid. The curve may begin near pH 1, rise slowly, increase sharply near 25.0 mL, and then level off above pH 12. Each plotted point should come from a recorded buret volume and a stable pH-meter reading. Near the steep region, smaller volume additions provide better evidence about where neutralization occurs. The curve’s shape also gives chemical information. A strong acid–strong base titration has a steep rise centered near pH 7, whereas a weak acid–strong base titration includes a buffer region and generally has an equivalence-point pH above 7.

Locating the Equivalence Point
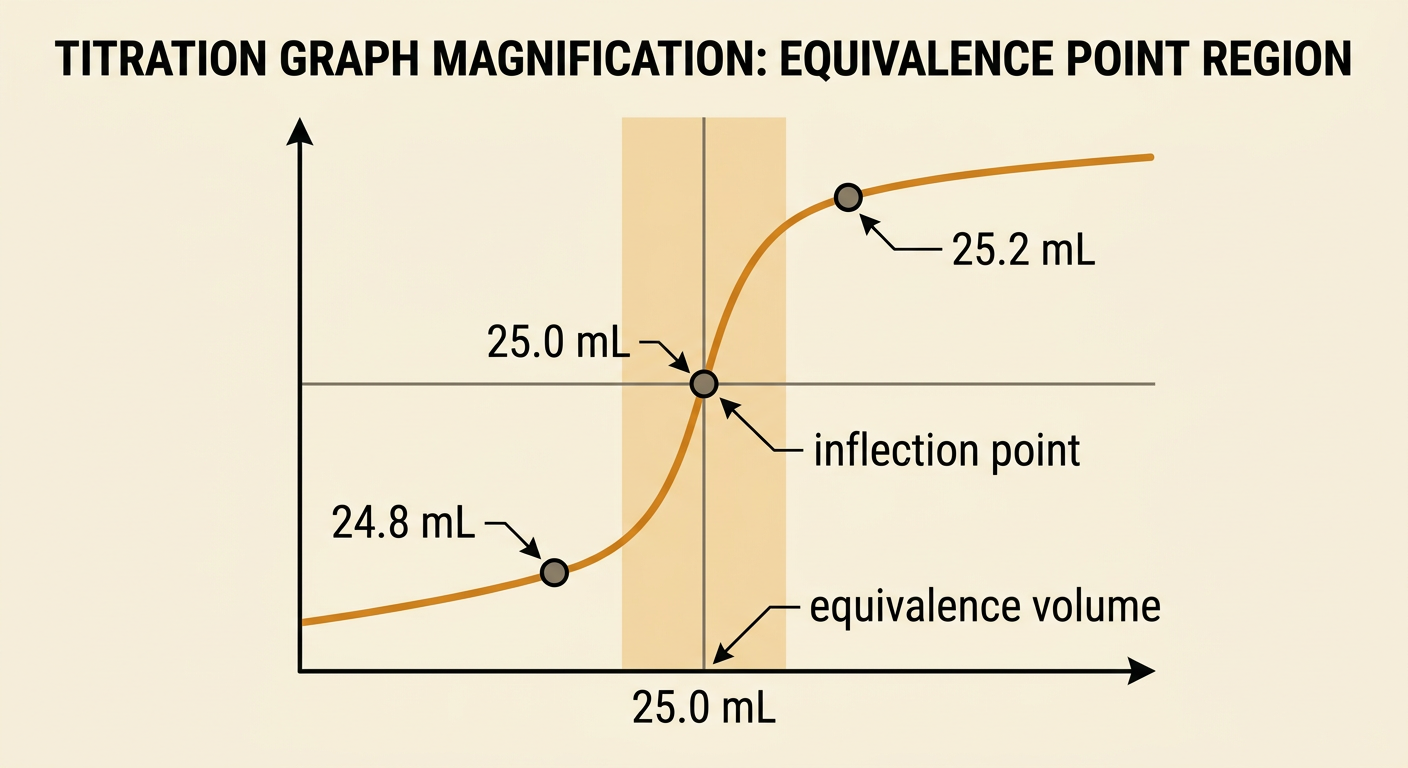
The equivalence point occurs when the titrant and analyte have reacted in the exact stoichiometric ratio required by the balanced equation. On a titration curve, it is located at the inflection point, near the middle of the steepest pH change. For example, measurements might show pH 4.2 at 24.8 mL, pH 7.0 at 25.0 mL, and pH 9.8 at 25.2 mL. The steep change is centered at approximately 25.0 mL, so that is the estimated equivalence volume. For a strong acid titrated by a strong base, the equivalence-point pH is about 7 at 25°C. However, equivalence does not always mean pH 7. A weak acid titrated with a strong base usually has an equivalence-point pH above 7 because the conjugate base reacts with water. The indicator endpoint should fall within the curve’s steep region.
Calculating Unknown Concentration
After finding the equivalence volume, use the balanced equation to connect titrant moles to analyte moles. Suppose 25.00 mL of unknown hydrochloric acid requires 18.60 mL of 0.1000 M sodium hydroxide. The equation HCl + NaOH → NaCl + H2O has a 1:1 mole ratio. Convert volume to liters and calculate titrant moles: 0.1000 mol/L × 0.01860 L = 0.001860 mol NaOH. At equivalence, this equals 0.001860 mol HCl. Divide by the acid volume: 0.001860 mol ÷ 0.02500 L = 0.07440 mol/L HCl. Units guide every step: milliliters must become liters before multiplying by molarity. For reactions with other coefficients, use the coefficient ratio rather than assuming 1:1. The balanced equation also demonstrates conservation because the same numbers of H, Cl, Na, and O atoms appear before and after the reaction.

Neutralization and Water Quality
Titration data can guide decisions about acidic water from mine drainage, industrial discharge, or acid rain. If a water sample has high acidity, technicians can titrate it with a standardized base to determine how much neutralizing material is needed. For example, crushed limestone, CaCO3, can consume acid and raise pH, making water less harmful to aquatic organisms and pipes. Treatment must be controlled because adding too much base can create water that is also unsafe. Decision makers should compare options such as limestone beds, chemical dosing, wetland restoration, pollution prevention, and continued monitoring. They should consider effectiveness, cost, waste products, habitat disturbance, and community impacts. A responsible action plan might combine source reduction with measured treatment and public reporting. Titration supports the plan with quantitative evidence, but pH alone is not enough; dissolved metals, alkalinity, flow rate, and biological health should also be measured before and after action.
