Analyzing Key Features of Quadratic Graphs
Students interpret the vertex, intercepts, axis of symmetry, and intervals of increase or decrease on graphs of quadratic functions.
Illustrations are auto-generated and may be placeholders. They can be refreshed to match the narration.
Review the Shape of a Parabola
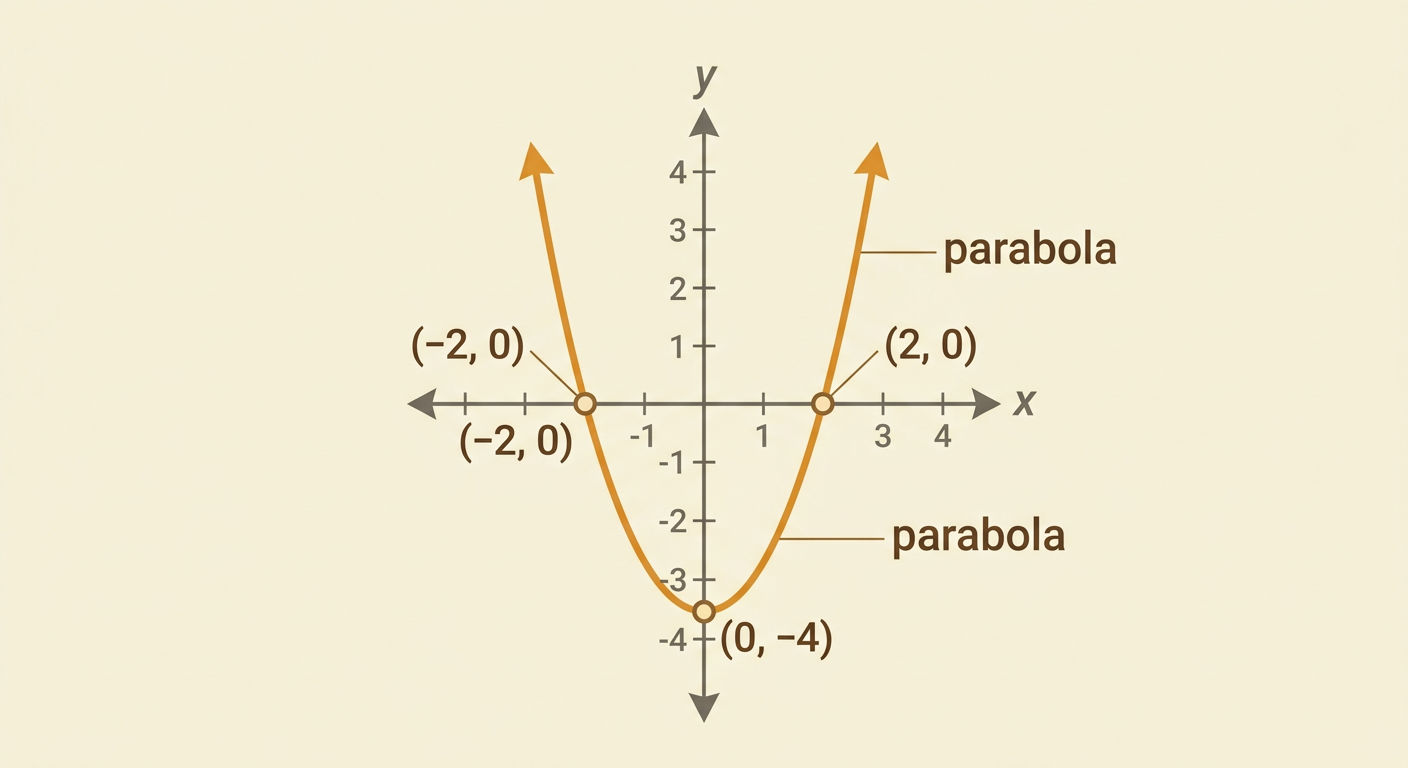
A quadratic function graphs as a curved shape called a parabola. In the standard form y = ax² + bx + c, the sign of a determines the direction in which the parabola opens. If a is positive, the graph opens upward and has a lowest point. If a is negative, it opens downward and has a highest point. The size of |a| also affects the width: a larger value produces a narrower graph. For example, y = x² - 4 opens upward. It passes through (0, -4), (2, 0), and (-2, 0). The graph is symmetric, so points with opposite x-values have the same y-value. Recognizing this shape and symmetry helps you locate and interpret the graph’s other key features.
Identify the Vertex and Axis of Symmetry
The vertex is the turning point of a parabola. It is the minimum point when the graph opens upward and the maximum point when it opens downward. The vertical line through the vertex is the axis of symmetry, which divides the parabola into matching halves. Vertex form, y = a(x - h)² + k, makes these features easy to identify: the vertex is (h, k), and the axis of symmetry is x = h. For example, in y = 2(x - 3)² - 5, the vertex is (3, -5), and the axis of symmetry is x = 3. Because a = 2 is positive, the vertex is a minimum. Points equally far from x = 3, such as x = 2 and x = 4, have the same y-value.

Locate and Interpret Intercepts
Intercepts show where a graph meets the coordinate axes. An x-intercept occurs where y = 0, and a y-intercept occurs where x = 0. A quadratic may have two, one, or no real x-intercepts, but it has exactly one y-intercept. Consider y = x² - 5x + 6. Factoring gives y = (x - 2)(x - 3), so y equals zero when x = 2 or x = 3. Therefore, the x-intercepts are (2, 0) and (3, 0). To find the y-intercept, substitute x = 0: y = 6, giving (0, 6). In a real situation, an x-intercept may represent when a quantity reaches zero, while the y-intercept often represents the quantity’s initial value.

Determine Increasing and Decreasing Intervals
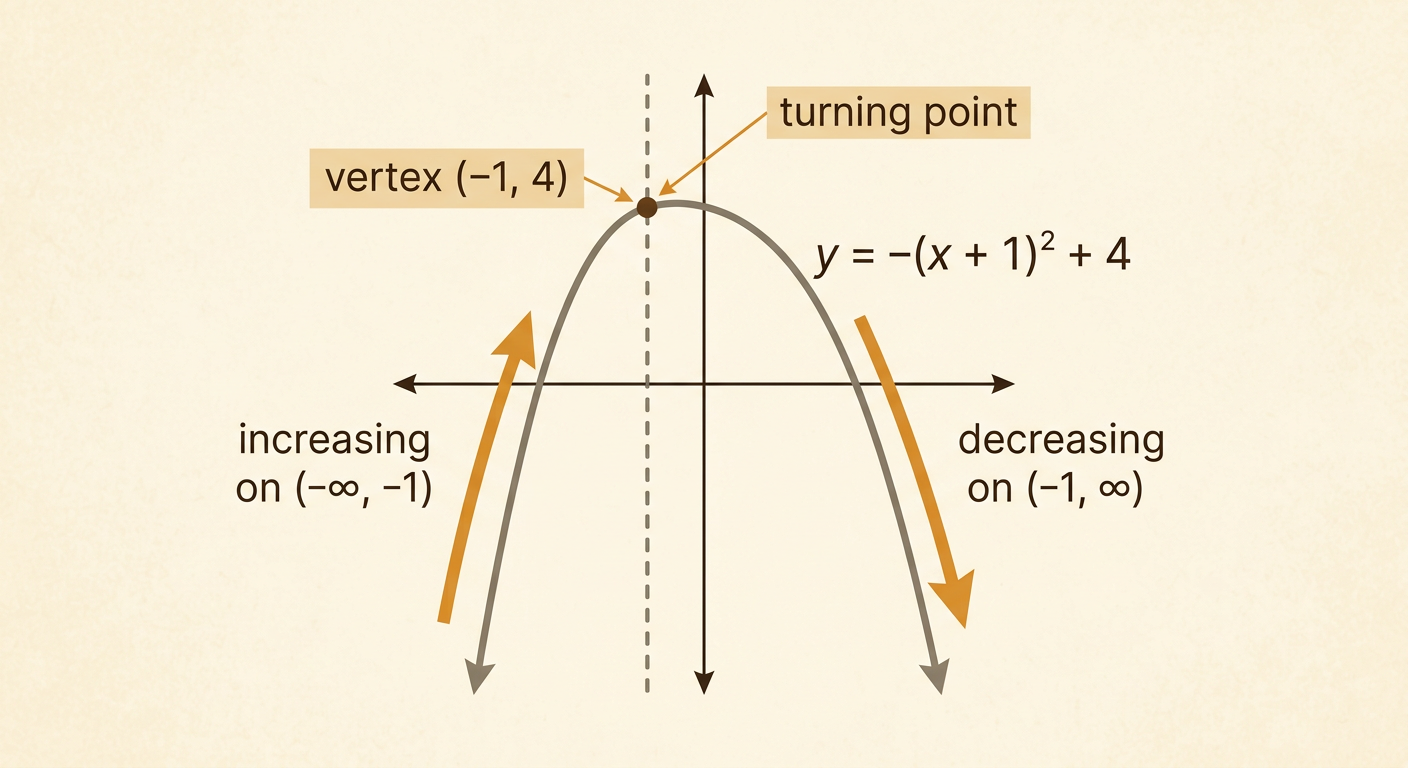
A function is increasing where its y-values rise as x moves from left to right. It is decreasing where its y-values fall. The vertex separates these intervals for a quadratic function. For example, y = -(x + 1)² + 4 opens downward and has vertex (-1, 4). To the left of x = -1, the graph rises toward the vertex, so the function is increasing on the interval (-∞, -1). To the right of x = -1, the graph falls away from the vertex, so it is decreasing on (-1, ∞). The vertex itself is not included in either open interval because it is the turning point. Always describe increasing and decreasing intervals using x-values, not y-values, and read the graph from left to right.
Analyze a Quadratic Graph in Context
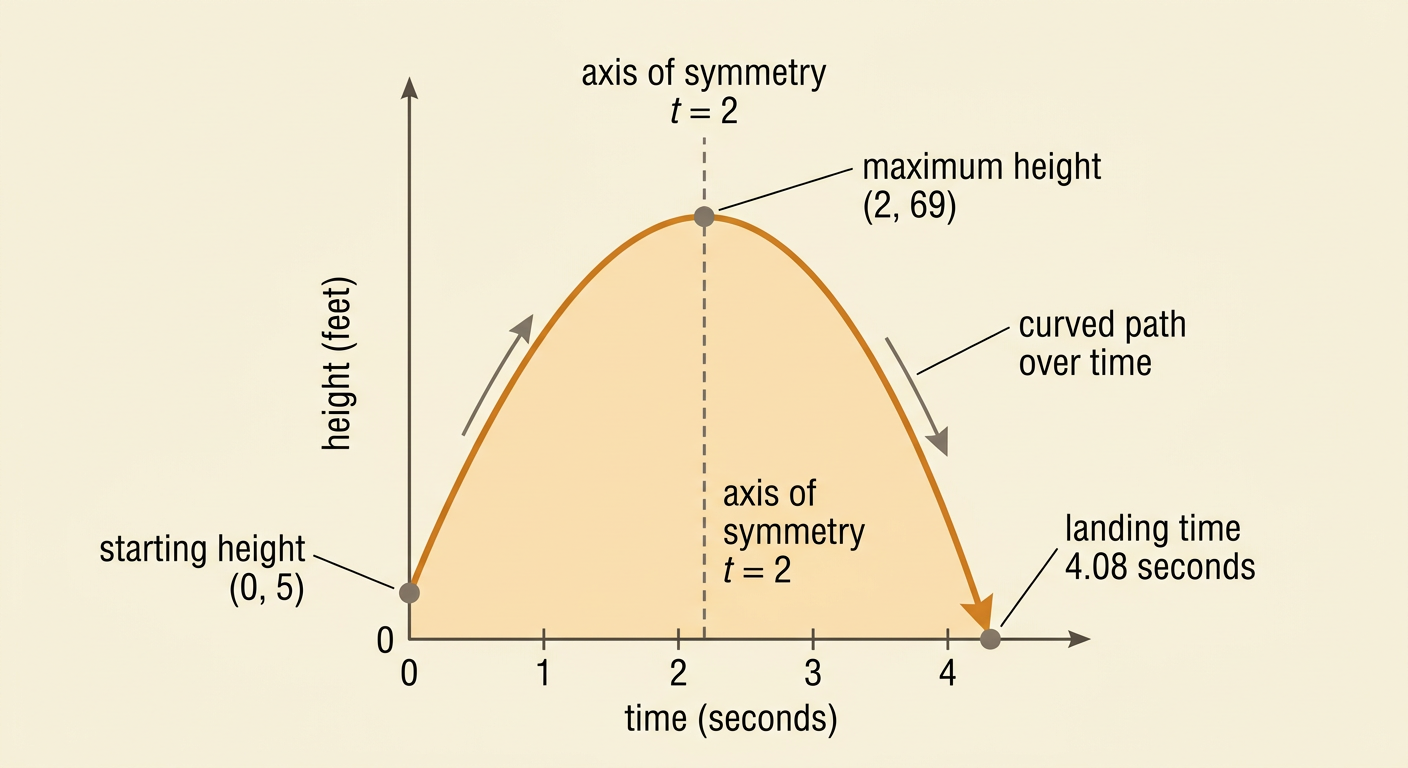
Key features of a quadratic graph have meanings connected to the quantities being modeled. Suppose a ball’s height in feet after t seconds is h(t) = -16t² + 64t + 5. The y-intercept (0, 5) means the ball starts 5 feet above the ground. Because the leading coefficient is negative, the graph opens downward. Its vertex occurs at t = 2 and has height 69, so the ball reaches a maximum height of 69 feet after 2 seconds. The axis of symmetry is t = 2. During the meaningful domain, the height increases from t = 0 to t = 2 and decreases from t = 2 until the ball reaches the ground at about t = 4.08 seconds. Only nonnegative time values through the landing time make sense in this situation.