Antibiotic Resistance: Natural Selection in Action
Students analyze bacterial survival data to explain how heritable variation and antibiotic selection can cause resistant populations to become more common over generations.
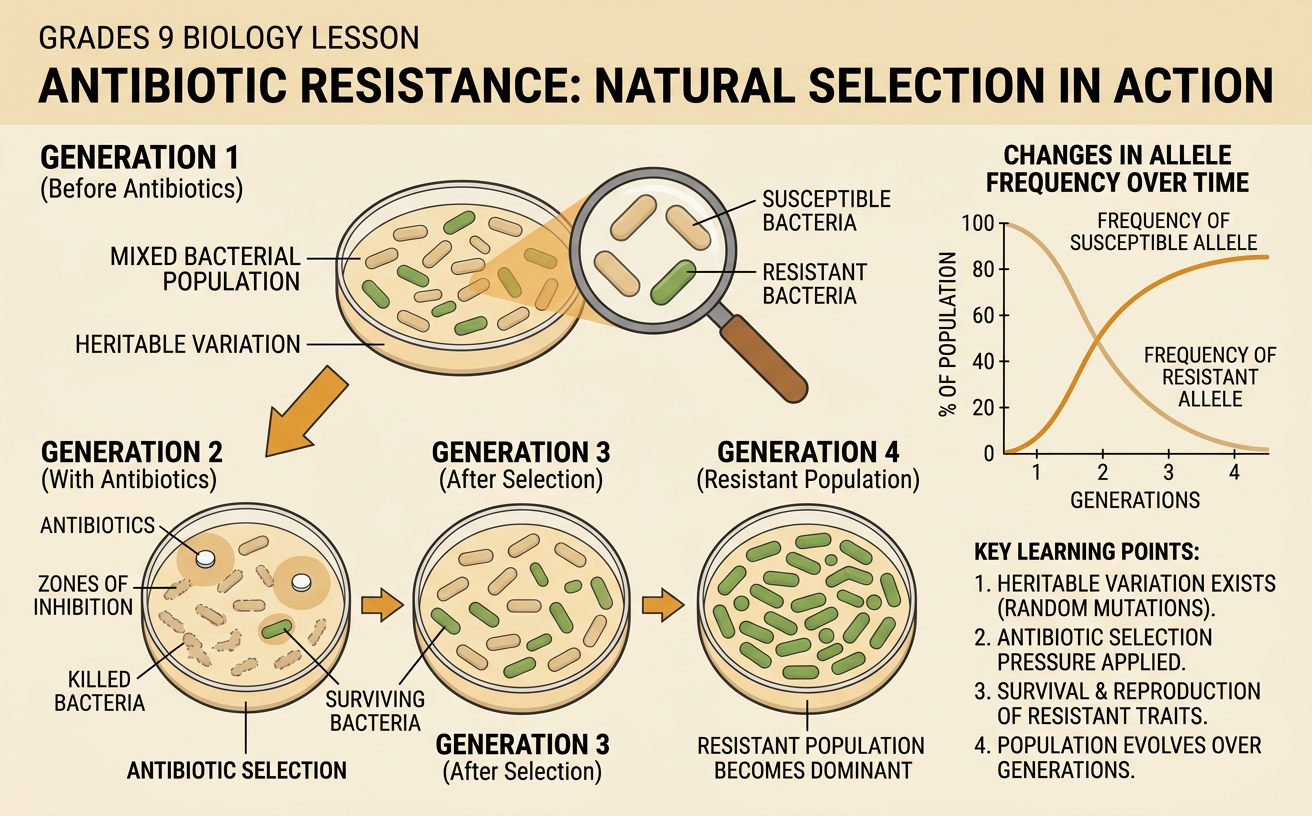
Illustrations are auto-generated and may be placeholders. They can be refreshed to match the narration.
Variation in Bacterial Populations
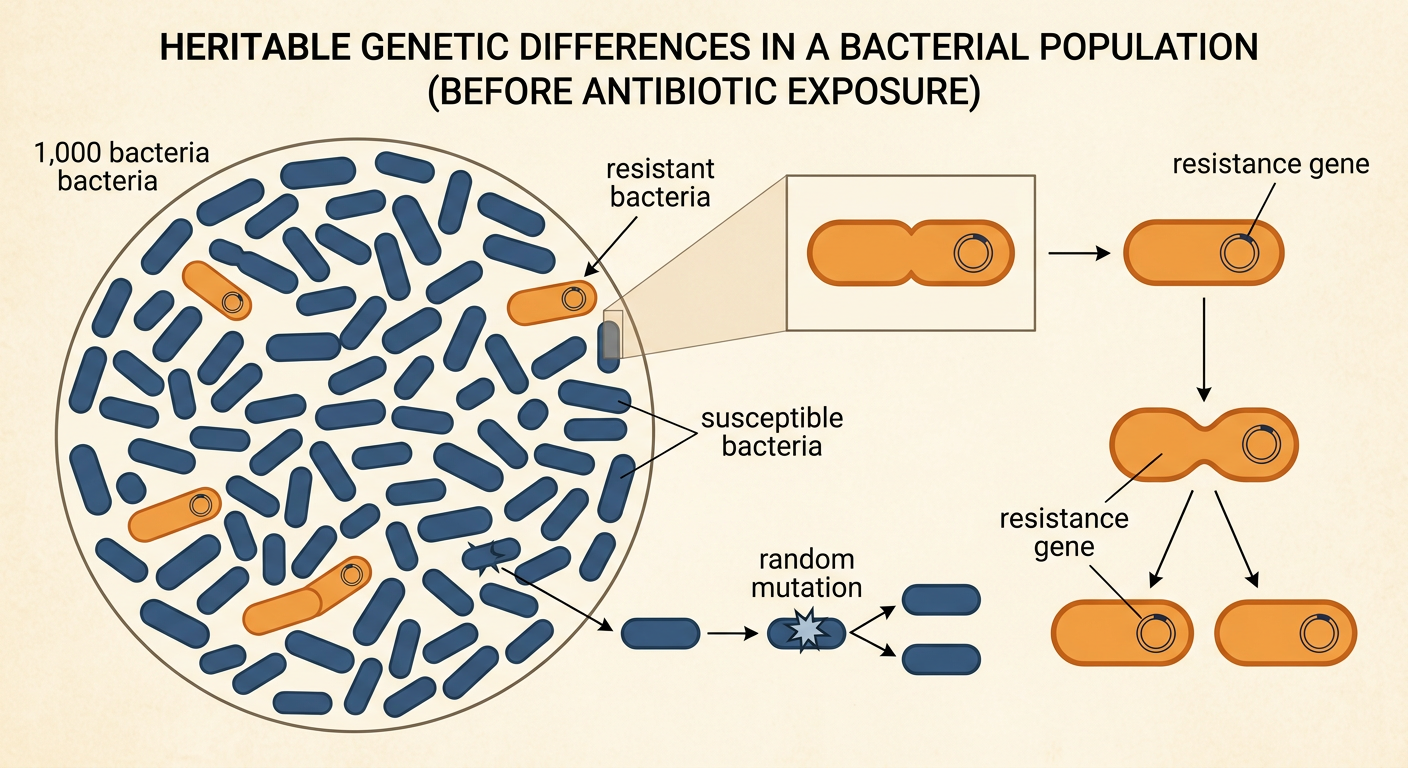
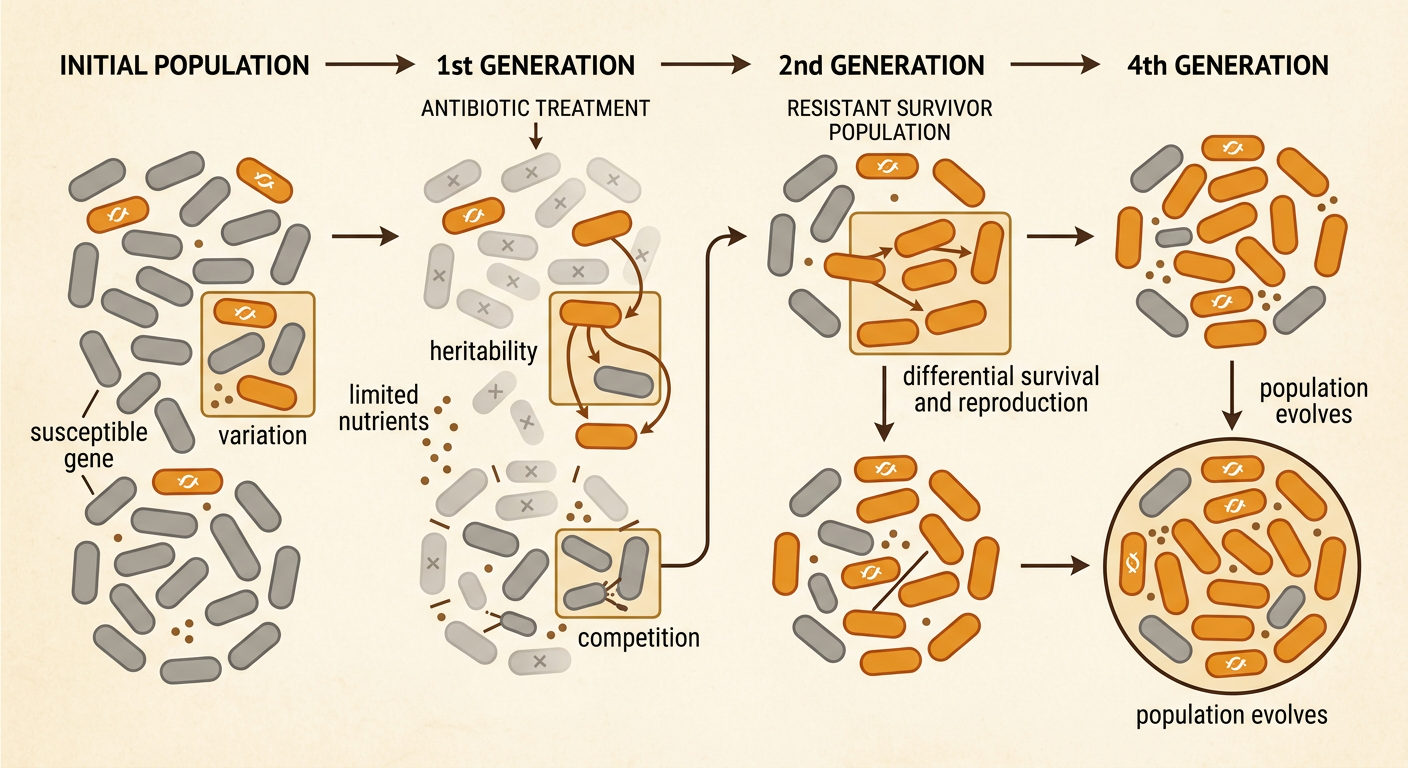
A bacterial population contains individuals with heritable differences. Random DNA mutations can create new traits, and bacteria may also acquire resistance genes from other bacteria. Some differences affect whether a bacterium can survive a particular antibiotic. For example, imagine a population of 1,000 bacteria. Most have a version of a protein that is easily blocked by an antibiotic, but a few carry a gene for a protein the drug cannot block. Before treatment, resistant bacteria may be rare because resistance does not always provide an advantage. When bacteria reproduce by cell division, their offspring usually inherit their genes, including resistance genes. The antibiotic does not create the needed trait because the bacteria “try” to survive. Instead, variation already exists or arises randomly, and that variation provides the raw material for natural selection.
Antibiotics as a Selection Pressure
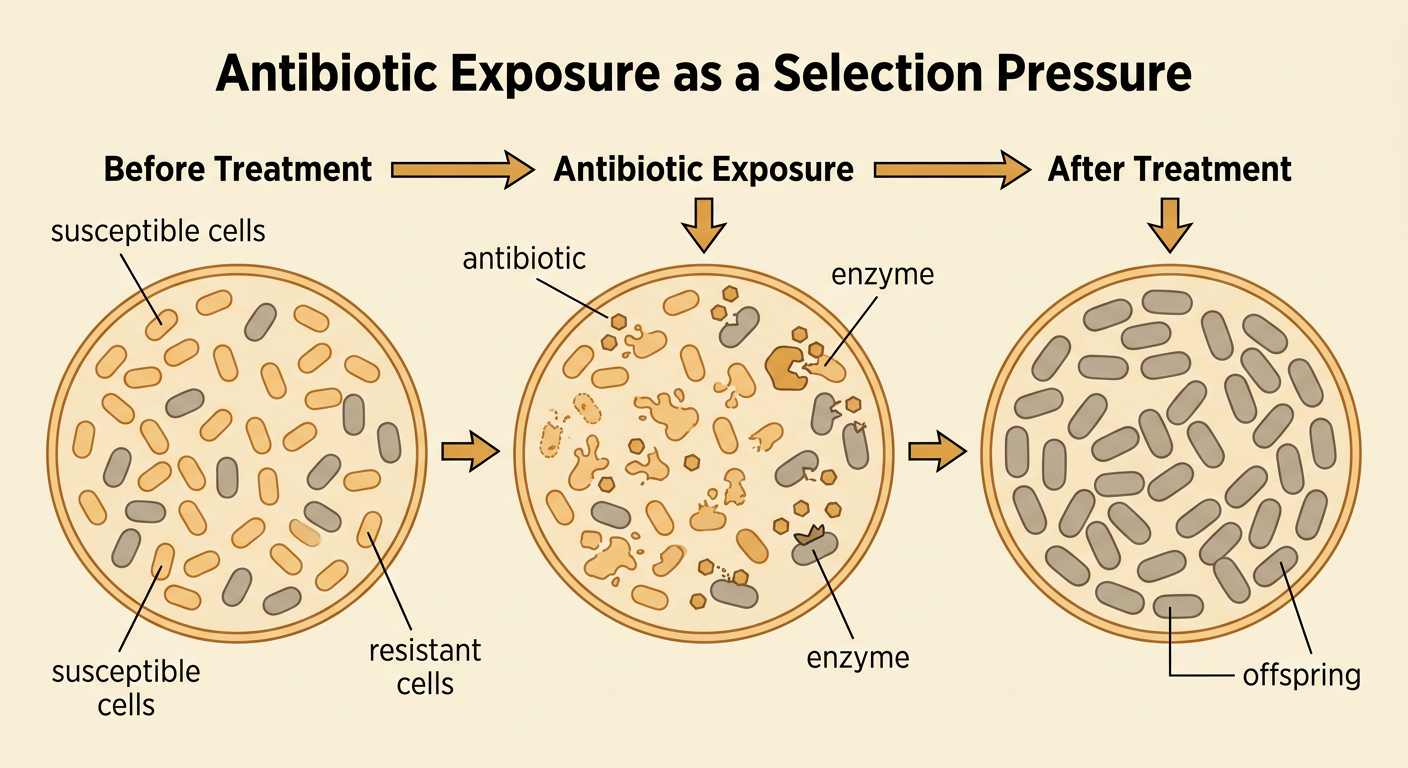
An antibiotic is a selection pressure because it changes which bacteria are most likely to survive and reproduce. Suppose an antibiotic is added to a culture containing susceptible and resistant bacteria. The drug kills or stops the growth of many susceptible cells. Resistant cells are more likely to survive because of traits such as an altered drug target or an enzyme that breaks down the antibiotic. The survivors then reproduce and compete for available nutrients and space. As a result, resistant bacteria contribute more offspring to the next generation. The antibiotic does not make individual bacteria adapt on purpose. Instead, it produces differential survival and reproduction among bacteria with different inherited traits. If antibiotic exposure continues, the population may become mostly resistant even though the original population contained very few resistant cells.
Graphing Bacterial Survival Data
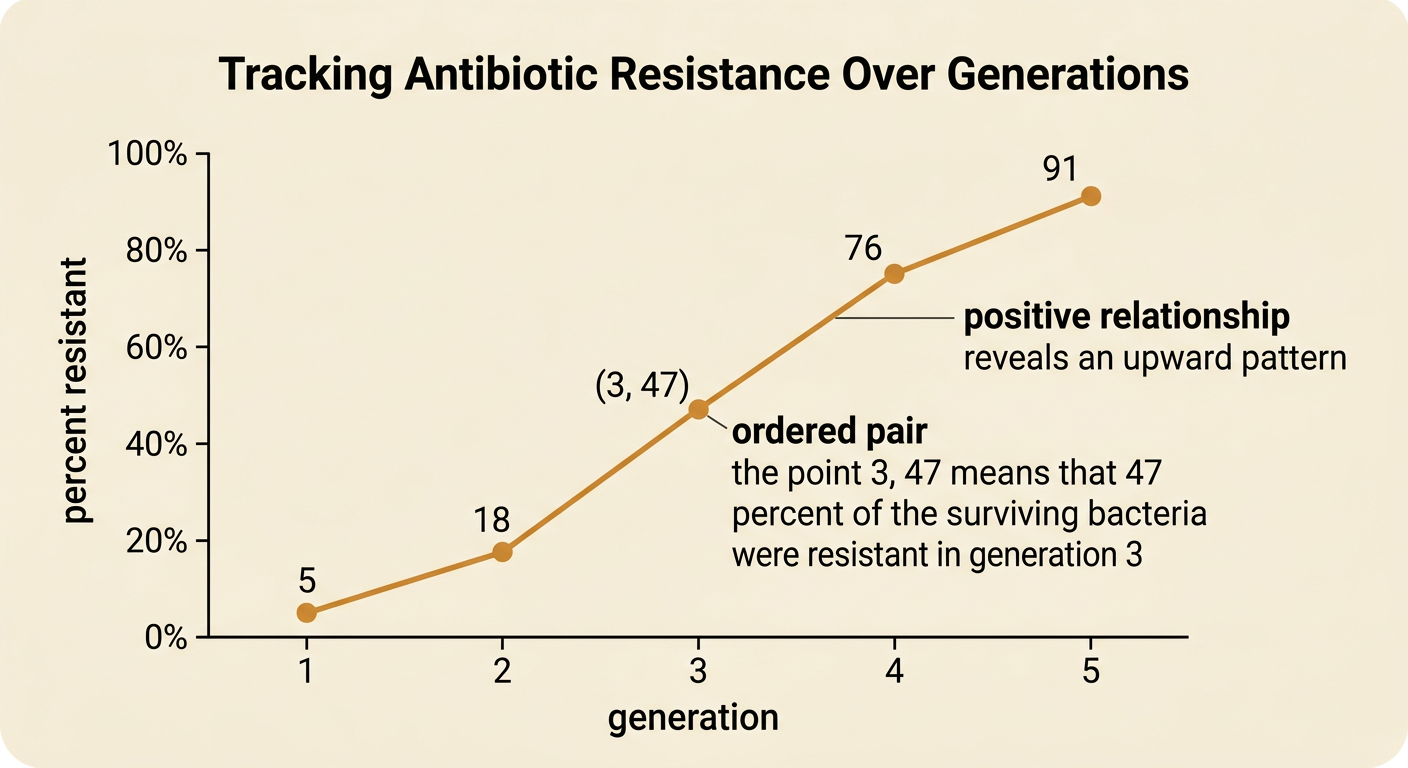
Graphs can reveal how bacterial resistance changes across generations. Consider a culture exposed to the same antibiotic during five generations. The percentage of surviving bacteria that are resistant is 5% in generation 1, 18% in generation 2, 47% in generation 3, 76% in generation 4, and 91% in generation 5. Plot generation number on the horizontal axis and percent resistant on the vertical axis. Each ordered pair, such as (3, 47), represents one generation and its measured resistance percentage. The upward pattern shows a positive relationship: as generation number increases under repeated antibiotic exposure, the percentage of resistant bacteria also increases. The graph summarizes the pattern, but the biological explanation requires additional evidence about inheritance, survival, and reproduction. A single data set also does not prove that every bacterial population will change at the same rate.
Explaining Resistance Across Generations
An evidence-based explanation of antibiotic resistance must connect variation, heritability, competition, and differential survival and reproduction. First, bacteria vary: some carry resistance traits, while others do not. Second, those traits can be inherited when resistant bacteria reproduce. Third, bacteria compete for limited nutrients and space. Finally, during antibiotic treatment, resistant bacteria are more likely to survive and produce offspring than susceptible bacteria. For example, if 10 of 1,000 bacteria initially carry a resistance gene, treatment may kill most of the other 990. If the 10 survivors divide repeatedly, their resistant descendants can form a large share of the later population. The population evolves because the frequency of a heritable trait changes across generations. Individual bacteria do not evolve during their lifetimes; the genetic composition of the population changes over time.
Antibiotic Use and Public Health
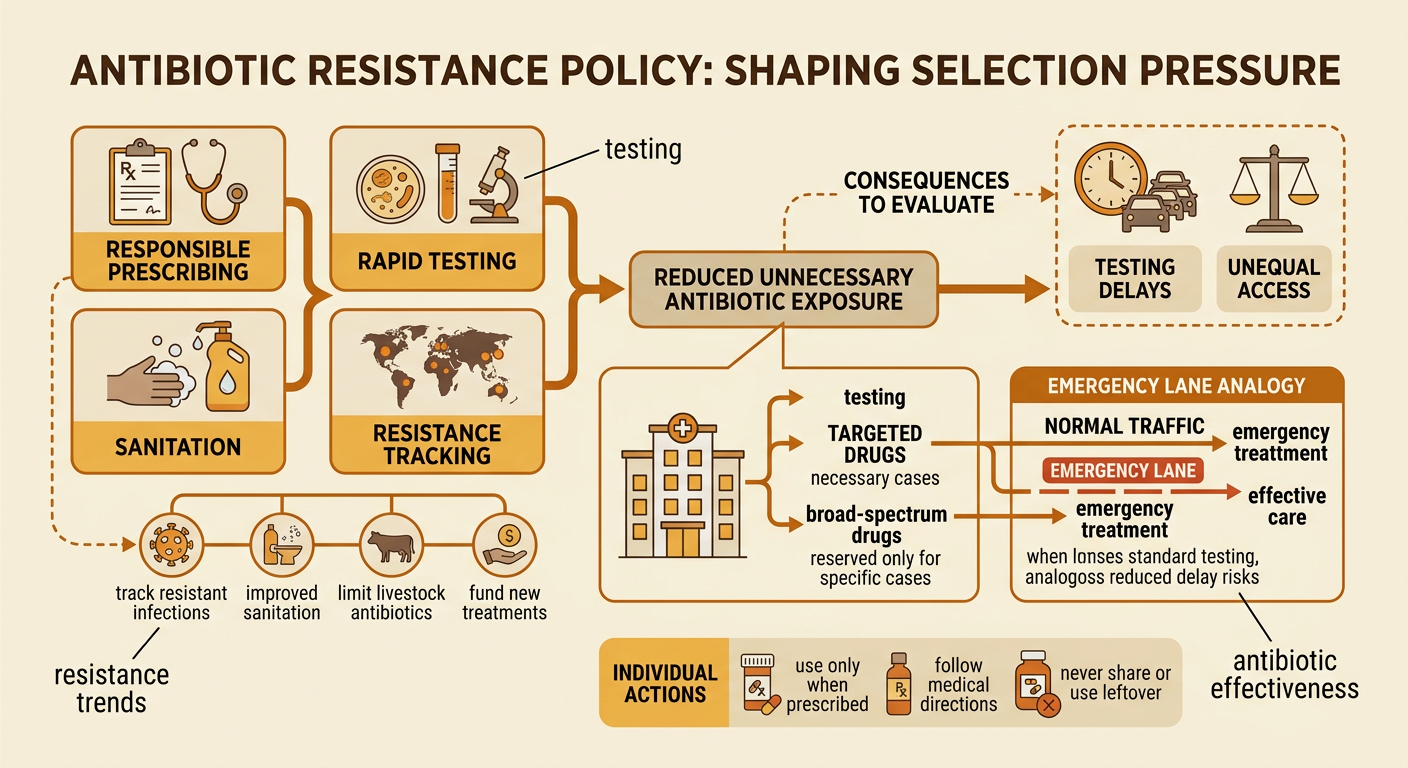
Antibiotic resistance affects both individual patients and entire communities, so public policy can influence selection pressure. A hospital policy might require testing before certain antibiotics are prescribed and reserve broad-spectrum drugs for cases in which they are necessary. The intended outcome is effective treatment with less unnecessary antibiotic exposure. A possible unintended outcome is delayed treatment if testing is too slow, so policies must include procedures for emergencies. Other approaches include tracking resistant infections, limiting routine antibiotic use in livestock, improving sanitation, and funding new treatments. Individuals can help by using antibiotics only when prescribed, following current medical directions, and never sharing leftover medicine. Antibiotics do not treat viral illnesses such as influenza. Policymakers should compare evidence about infection rates, patient outcomes, costs, access to care, and resistance trends. A strong policy balances immediate treatment needs with the long-term goal of preserving antibiotic effectiveness.