Atmospheric Chemistry, Air Pollution, and Solutions
Students examine the chemical sources and effects of common air pollutants, interpret air-quality data, and propose a method for monitoring or reducing pollution.

Illustrations are auto-generated and may be placeholders. They can be refreshed to match the narration.
What Is in Earth’s Atmosphere?
Earth’s atmosphere is a mixture of gases held near the planet by gravity. Dry air is about 78 percent nitrogen, 21 percent oxygen, and nearly 1 percent argon. Carbon dioxide makes up about 0.04 percent, while other gases occur in tiny amounts. Air also contains changing amounts of water vapor, as well as small solid and liquid particles called aerosols. Most weather and most air pollution occur in the troposphere, the lowest atmospheric layer. Although oxygen and nitrogen are most abundant, gases present in much smaller amounts can strongly affect climate and health. For example, ozone near the ground can irritate lungs, while ozone higher in the stratosphere helps block harmful ultraviolet radiation. The location and concentration of a substance therefore matter as much as its identity.

Primary and Secondary Air Pollutants
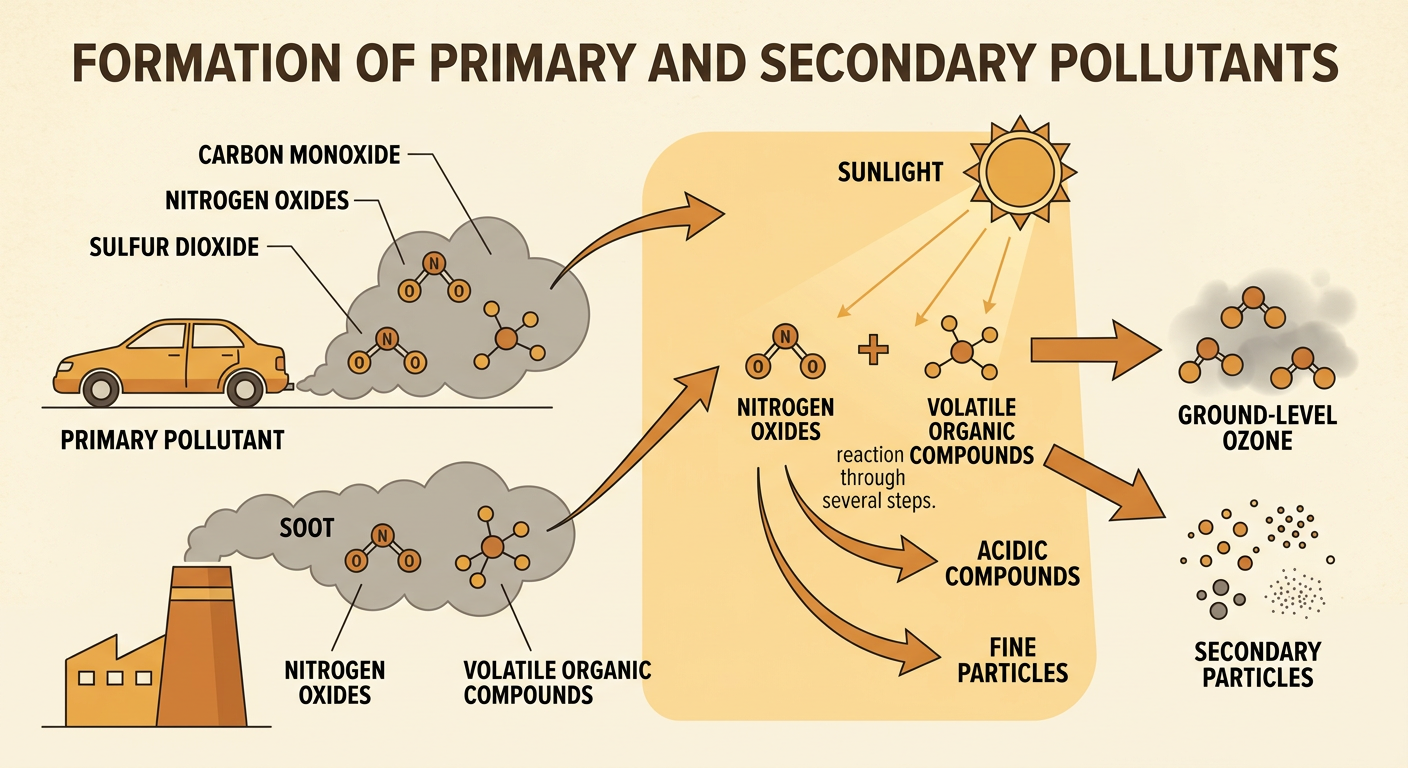
A primary pollutant enters the air directly from a source. Examples include carbon monoxide from incomplete combustion, sulfur dioxide from burning sulfur-containing fuels, nitrogen oxides from hot engines, and soot from fires or diesel exhaust. A secondary pollutant forms in the atmosphere when primary pollutants react with other substances. Ground-level ozone is a common example. In sunlight, nitrogen oxides and volatile organic compounds participate in a series of reactions that produce ozone. Some sulfur dioxide and nitrogen oxides also react with oxygen and water to form acidic compounds and fine particles. For example, car exhaust released during morning traffic contains primary pollutants. As sunlight becomes stronger, atmospheric reactions can increase ground-level ozone during the afternoon. Distinguishing the two types helps communities decide whether to control direct emissions or the chemicals that form pollution later.
Chemical Sources of Air Pollution
Many air pollutants come from combustion, the chemical reaction in which a fuel reacts with oxygen and releases energy. Complete combustion of a hydrocarbon mainly produces carbon dioxide and water. When oxygen is limited, incomplete combustion can also produce carbon monoxide and soot. High temperatures inside engines allow nitrogen and oxygen from the air to react, forming nitrogen oxides. Coal and oil may contain sulfur, which can become sulfur dioxide when the fuel burns. Volatile organic compounds can evaporate from gasoline, paints, solvents, and some industrial processes. Natural events, including wildfires, dust storms, and volcanic eruptions, also add gases and particles to the air. For example, a poorly adjusted gasoline engine may release more carbon monoxide because its fuel does not burn completely. Identifying each source helps engineers choose an effective control method.

Reading Air-Quality Data
Air-quality data show how pollutant concentrations change across time and place. The Air Quality Index, or AQI, converts measurements of major pollutants into a scale that communicates health concern. Higher AQI values indicate greater risk, but students should also examine which pollutant is responsible. A time-series graph can reveal when pollution rises during a day, while a map can show where concentrations are highest. A scatter plot helps investigate an association between two numerical variables. Place the possible explanatory variable on the horizontal axis and the response variable on the vertical axis, then plot each paired measurement. For example, students might graph daily temperature against daily ozone concentration. An upward pattern suggests a positive association, not automatic proof that temperature alone caused the ozone change. Wind, sunlight, traffic, and other variables may also affect the results.

Impacts on Health and the Environment
Air pollutants affect people, ecosystems, buildings, and climate in different ways. Fine particulate matter can travel deep into the lungs, and the smallest particles may enter the bloodstream. Ground-level ozone can inflame airways and damage leaf tissue, reducing plant growth. Carbon monoxide interferes with the blood’s ability to carry oxygen. Sulfur dioxide and nitrogen oxides can contribute to acidic deposition and fine-particle formation. Acidic deposition may lower the pH of lakes and soils, harm sensitive organisms, and weather some stone structures. Pollution risk depends on concentration, exposure time, and a person’s health. Children, older adults, and people with asthma may be especially sensitive. For example, on a high-ozone afternoon, a student with asthma may need to reduce strenuous outdoor activity. Checking local air-quality guidance helps people lower exposure while communities work on long-term emission reductions.

Monitoring and Reducing Pollution
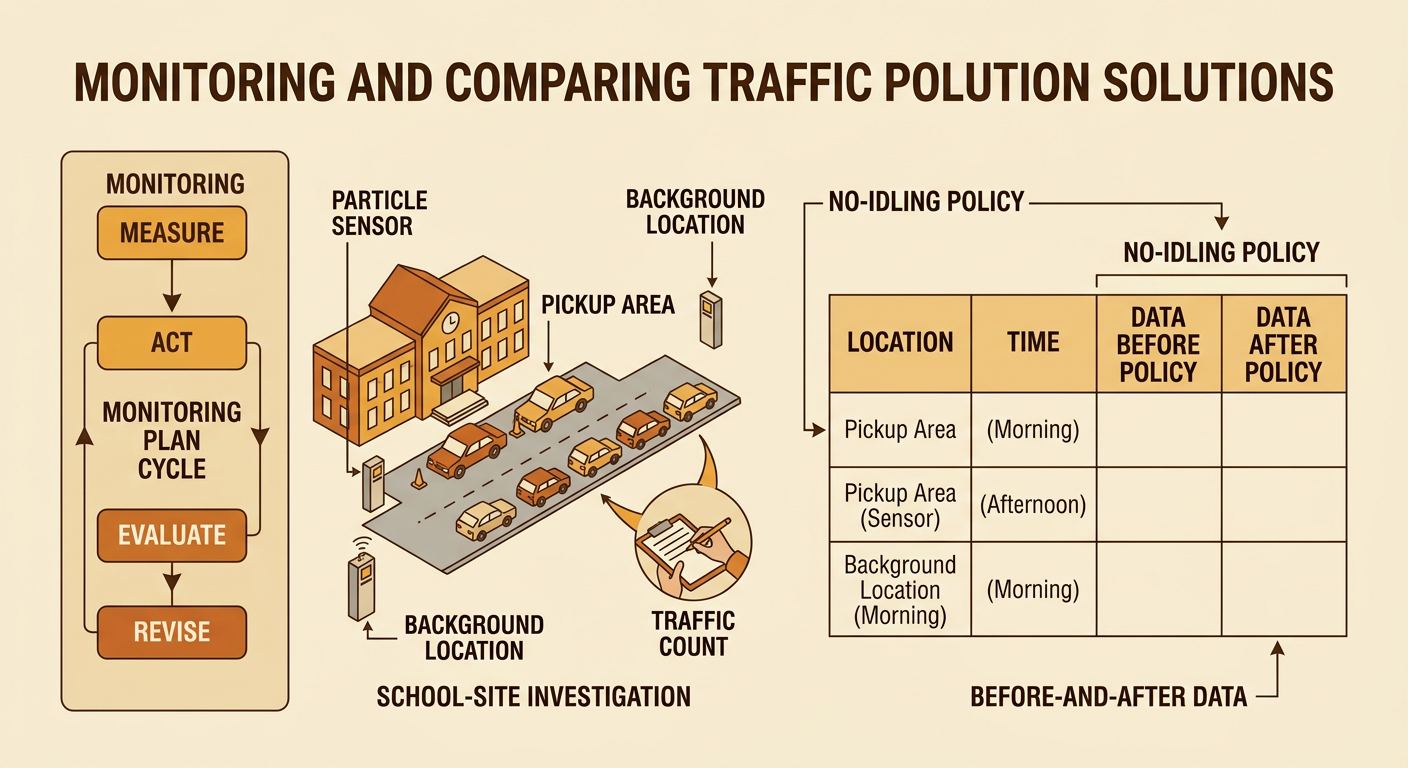
A strong pollution plan uses evidence to define a problem, measure change, and compare solutions. To monitor traffic pollution near a school, students could place calibrated particle sensors at the pickup area and at a background location away from traffic. Measurements should be taken at the same times for several days, with weather and traffic counts recorded. Repeated measurements and consistent sensor placement make the comparison more reliable. Possible reduction methods include limiting vehicle idling, improving public transportation, using cleaner energy, installing industrial controls, and conserving electricity. Students can evaluate each option by expected pollution reduction, cost, fairness, safety, and feasibility. A no-idling policy, for example, aims to reduce exhaust near students, but implementation requires clear signs, public communication, and enforcement. After adoption, before-and-after data can reveal intended benefits and unexpected consequences, helping officials revise the policy.