
Auditing an Algorithm for Fairness
Students analyze the outputs of a simple decision-making algorithm, use a two-way table to identify patterns, and recommend changes that improve accuracy and fairness.
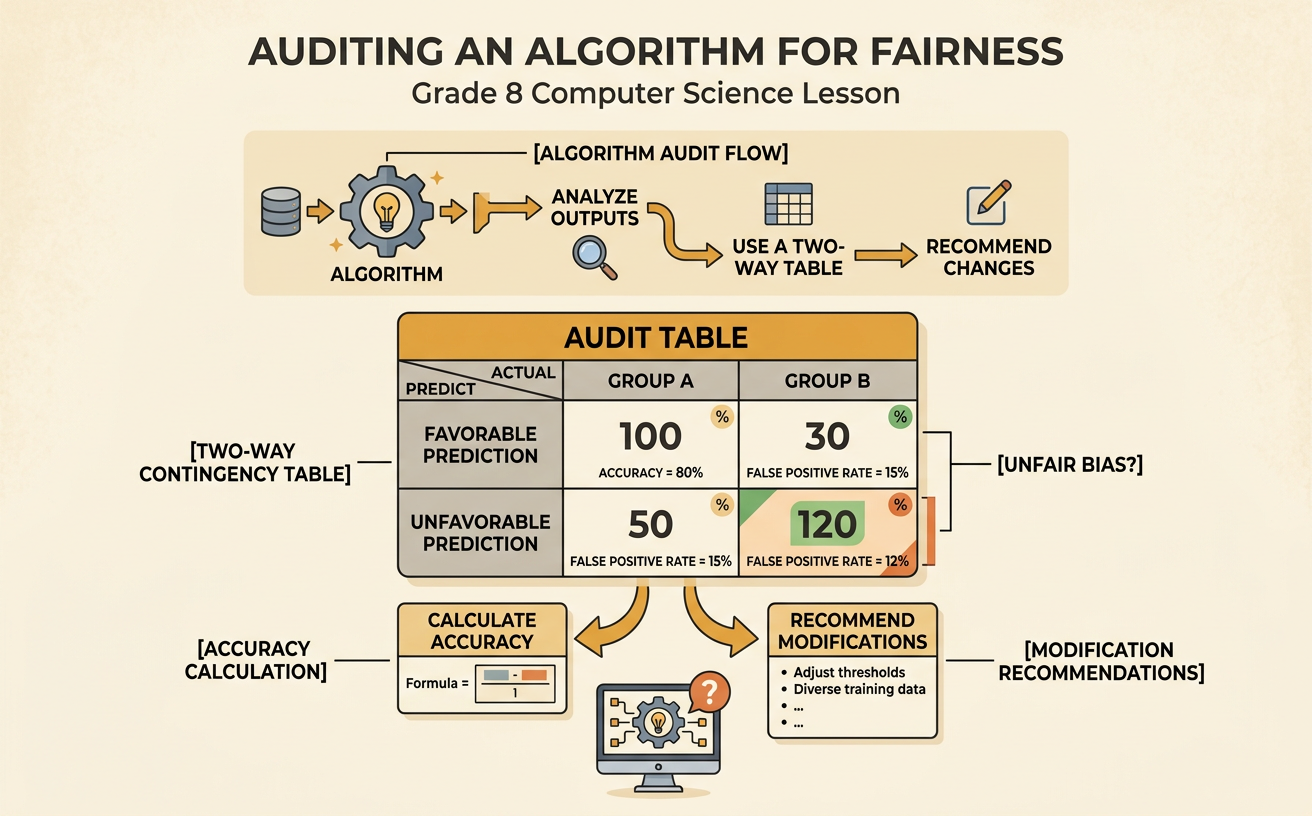
Illustrations are auto-generated and may be placeholders. They can be refreshed to match the narration.
How Decision-Making Algorithms Work
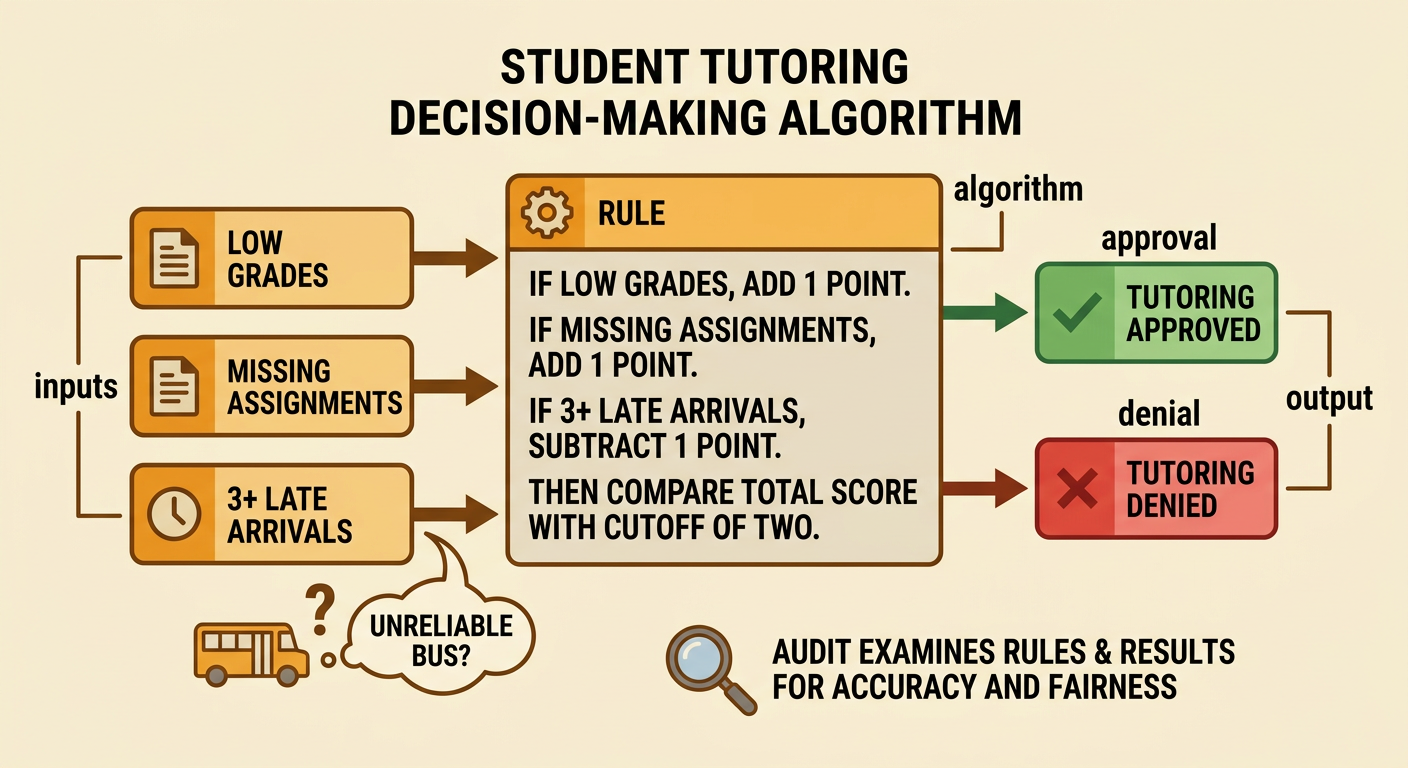
A decision-making algorithm follows a set of rules to turn inputs into outputs. Inputs are pieces of information, such as grades or completed assignments. The output may be a prediction, score, approval, or denial. Imagine that a school uses an algorithm to select students for a tutoring program. The algorithm adds points for low grades and missing assignments, but subtracts a point for three or more late arrivals. Students with scores of at least two are approved. This process may seem objective, yet people chose the inputs, point values, and cutoff. Late arrivals may be caused by an unreliable bus rather than a student's effort. As a result, the rule could disadvantage bus riders. Auditing means examining the rules and results to determine whether the algorithm is accurate, fair, and connected to the program's purpose.
Review the Input and Output Data
Begin an audit by checking what each column means and whether the data are complete. For each tutoring applicant, the file should show relevant inputs, the algorithm's output, and a reference result based on the school's official eligibility policy. The reference result lets auditors judge whether an output was correct. The audit file contains 40 applicants: 20 bus riders and 20 non-bus riders. In each group, 12 students actually qualify and 8 do not. The algorithm approves 10 bus riders and 13 non-bus riders. Before drawing conclusions, check for missing values, duplicate records, inconsistent definitions, and data-entry mistakes. Protect privacy by using identification numbers instead of names. Transportation status should be used to test for unequal outcomes, not automatically to decide who deserves tutoring. Accurate definitions and trustworthy records are necessary for a valid fairness audit.

Build a Two-Way Frequency Table
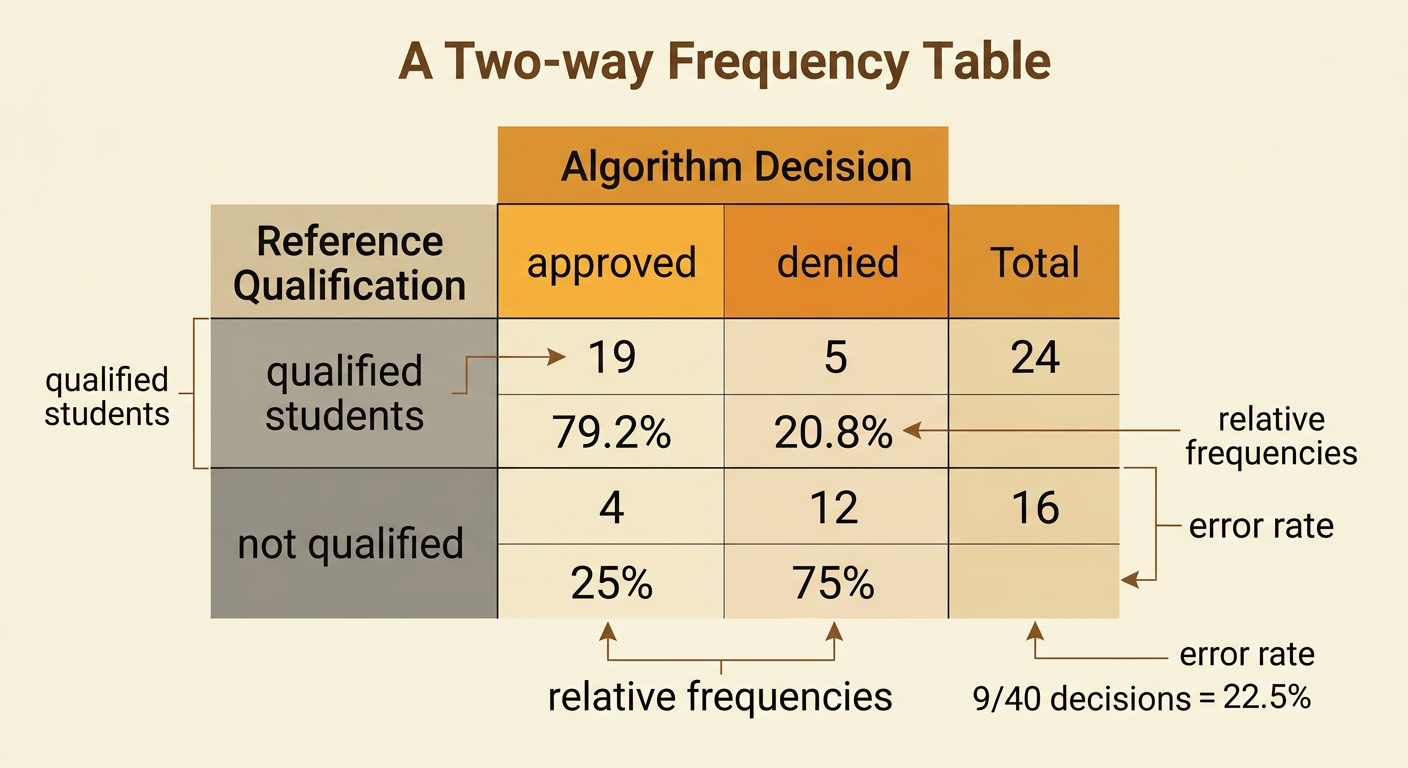
A two-way frequency table compares two categorical variables. Here, the rows show whether students actually qualified, and the columns show whether the algorithm approved or denied them. Among 24 qualified students, 19 were approved and 5 were denied. Among 16 students who did not qualify, 4 were approved and 12 were denied. The totals show 23 approvals, 17 denials, and 40 applicants. Relative frequencies make comparisons easier. Of the qualified students, 19 divided by 24, or 79.2 percent, were approved, while 20.8 percent were incorrectly denied. Of the students who did not qualify, 25 percent were incorrectly approved and 75 percent were correctly denied. Overall, 9 of 40 decisions were errors, giving an error rate of 22.5 percent. Both frequencies and percentages reveal important patterns.
Identify Errors and Unequal Outcomes
An approval for a qualified student and a denial for an unqualified student are correct results. A qualified student who is denied is a false denial, while an unqualified student who is approved is a false approval. Group comparisons can reveal whether errors are distributed unequally. Among qualified bus riders, 8 of 12, or 66.7 percent, were approved. Among qualified non-bus riders, 11 of 12, or 91.7 percent, were approved. The approval-rate gap is 25 percentage points. Overall accuracy was 70 percent for bus riders and 85 percent for non-bus riders. This pattern does not by itself prove intentional discrimination, but it is evidence that the lateness rule may create an unfair barrier. Bus riders, families, teachers, and program staff may have different perspectives. A fair review should consider equal opportunity, student dignity, program goals, and responsible use of limited tutoring spaces.

Compare Possible Algorithm Improvements
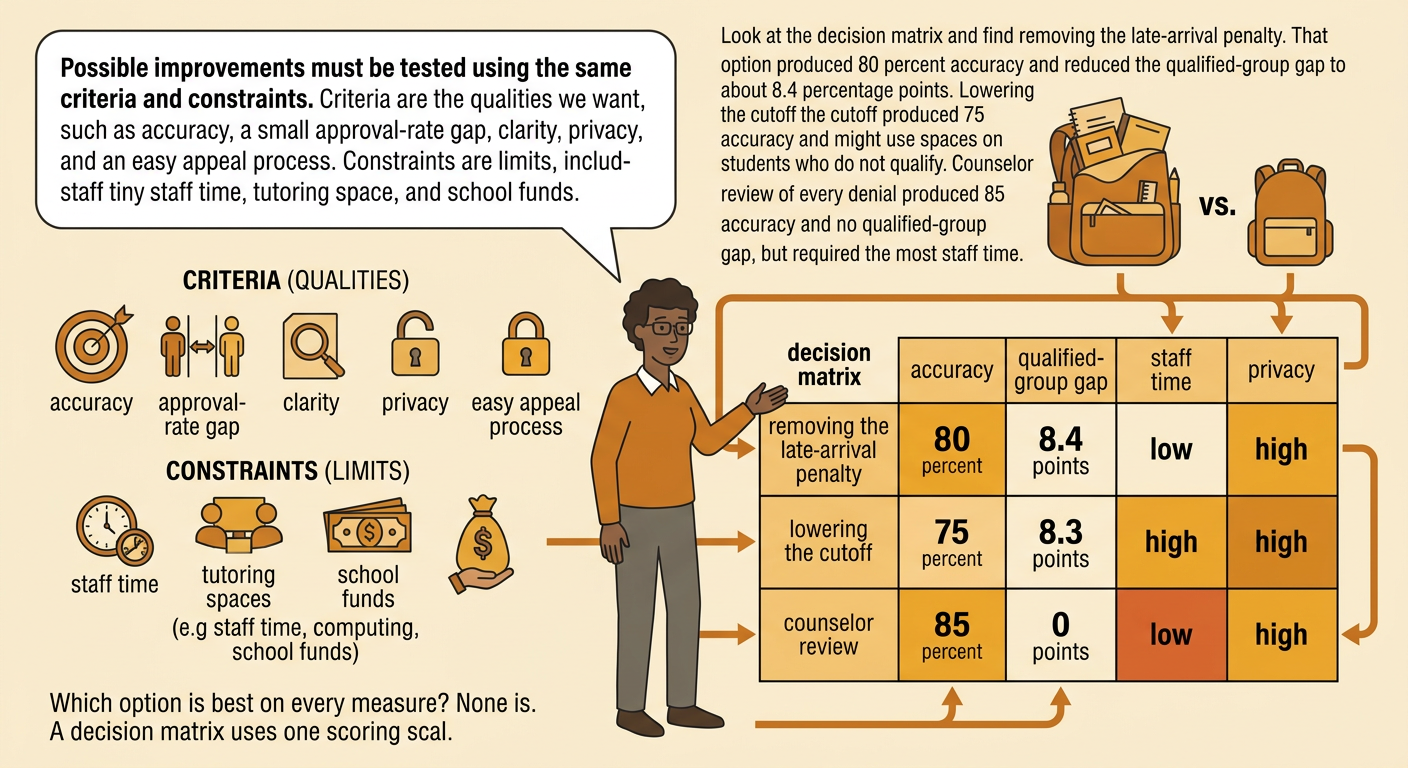
Possible improvements should be tested with the same criteria and constraints. Useful criteria include overall accuracy, the approval-rate gap between equally qualified groups, clarity, privacy, and ease of appeal. Constraints include limited staff time, tutoring spaces, and school funds. In a test using the 40 cases, removing the late-arrival penalty produced 80 percent accuracy and reduced the qualified-group gap to about 8.4 percentage points. Lowering the cutoff increased approvals but reduced accuracy to 75 percent and could fill spaces with students who did not qualify. Sending every denial to a counselor produced 85 percent accuracy and no qualified-group gap, but required the most staff time. No solution is best on every measure. A decision matrix allows reviewers to apply the same scoring scale and importance weights to each option rather than choosing the most convenient change.
Write a Fairness Recommendation
A fairness recommendation should state the proposed change, cite evidence, acknowledge tradeoffs, and explain how results will be monitored. For example: The school should remove the late-arrival penalty because arrival time is influenced by transportation conditions and is not part of the official tutoring eligibility policy. In testing, this change raised accuracy from 77.5 percent to 80 percent and reduced the qualified-group approval gap from 25 points to about 8.4 points. The school should also allow students to appeal denials to a counselor when information is missing or incorrect. This plan protects equal opportunity while limiting the staff burden of reviewing every case. After one grading period, the school should publish anonymous error rates by transportation group and ask students, families, teachers, and staff for feedback. If a large gap remains, the rules should be revised and tested again.
