Automation, Artificial Intelligence, and the Future of Work
Students analyze labor-market data and competing policy proposals to determine how governments should respond to job displacement and economic change caused by automation and artificial intelligence.

Illustrations are auto-generated and may be placeholders. They can be refreshed to match the narration.
How Automation Changes Work
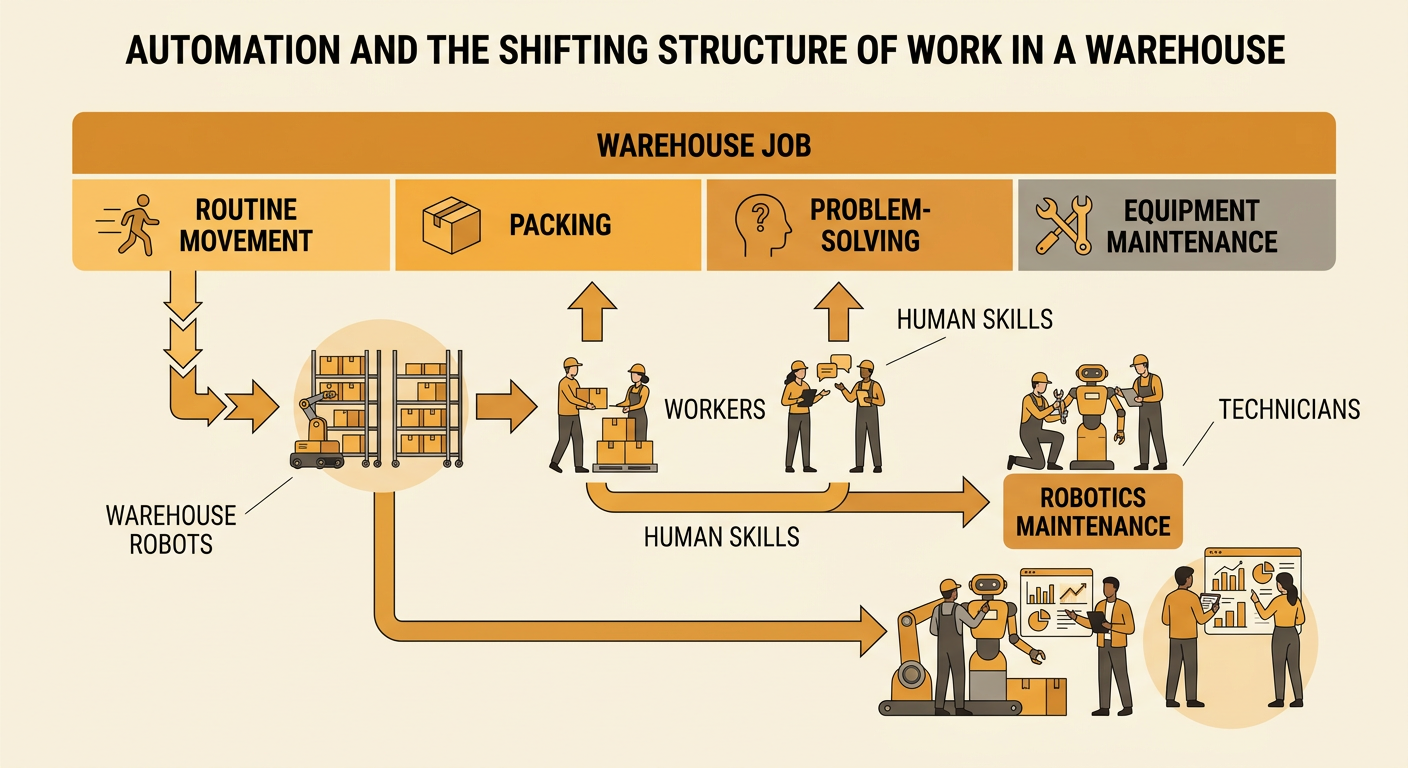
Automation changes work by shifting which tasks people and machines perform. It does not always eliminate an entire occupation. Machines often replace routine, predictable tasks while creating demand for workers who design, maintain, supervise, or use the technology. Automation can substitute for labor, complement human skills, or do both at once. For example, a warehouse may introduce robots that move shelves to packing stations. Fewer workers may be needed to walk through aisles, but more technicians may be needed to repair robots, analyze inventory data, and handle unusual orders. The final employment effect depends on productivity, consumer demand, worker retraining, and how quickly businesses adopt the technology. Therefore, forecasts should distinguish between tasks that can be automated and complete jobs that may contain many nonautomated tasks.
Reading Labor-Market Data
Labor-market data can reveal relationships between automation and employment, but the variables must be interpreted carefully. Suppose five industries have automation adoption rates of 10, 25, 40, 55, and 70 percent, while their employment changes are positive 4, positive 2, 0, negative 3, and negative 5 percent. A scatterplot would show a negative association: industries with higher adoption tended to have lower employment growth in this hypothetical sample. A line of best fit can summarize the direction and strength of the pattern. However, association does not prove that automation caused the changes. International trade, recessions, consumer preferences, wages, and industry growth may also affect employment. Analysts should examine the time period, sample size, data source, outliers, and whether employment counts, wages, or hours worked are being measured.

Benefits, Costs, and Unequal Effects
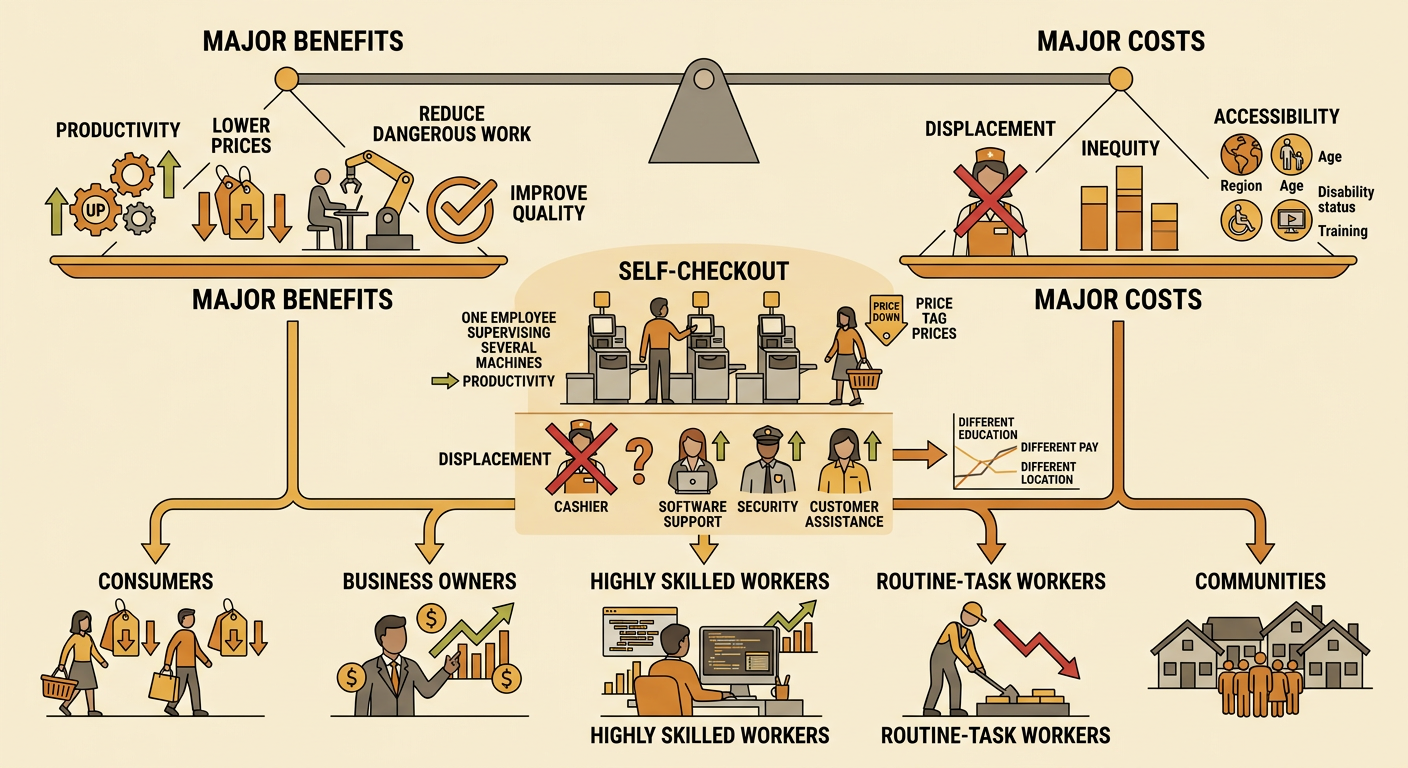
Automation and artificial intelligence can raise productivity, reduce dangerous work, improve product quality, and lower some prices. These gains can increase total economic output, but they may not be distributed equally. Owners and highly skilled workers may receive larger gains, while workers in routine occupations may face reduced hours, lower wages, or displacement. Effects also vary by region, education, age, disability status, and access to training. For example, self-checkout systems may reduce demand for some cashier tasks while increasing demand for software support, security, and customer assistance. A worker cannot necessarily move into those roles immediately because the new jobs may require different skills or be located elsewhere. Evaluating automation therefore requires both efficiency and equity measures, including productivity, prices, wages, job quality, unemployment duration, and how benefits and costs are distributed among groups.
Comparing Government Policy Responses
Governments can respond to displacement through several policies, each with different goals and trade-offs. Job-training grants aim to build skills, but programs work best when connected to actual employer demand. Wage insurance temporarily replaces part of the earnings lost when a displaced worker accepts a lower-paying job; it encourages faster reemployment but does not prevent a long-term wage gap. Expanded unemployment insurance provides immediate stability, although longer benefits increase public costs and may delay some job searches. A universal basic income offers broad income security but can be expensive because payments go to displaced and nondisplaced people. For example, a laid-off manufacturing worker might use unemployment benefits during a short training program and then receive wage insurance after entering a lower-paying technician role. Policymakers should compare speed, coverage, effectiveness, fairness, fiscal cost, administrative complexity, and effects on work incentives.

Evidence-Based Policy Recommendation
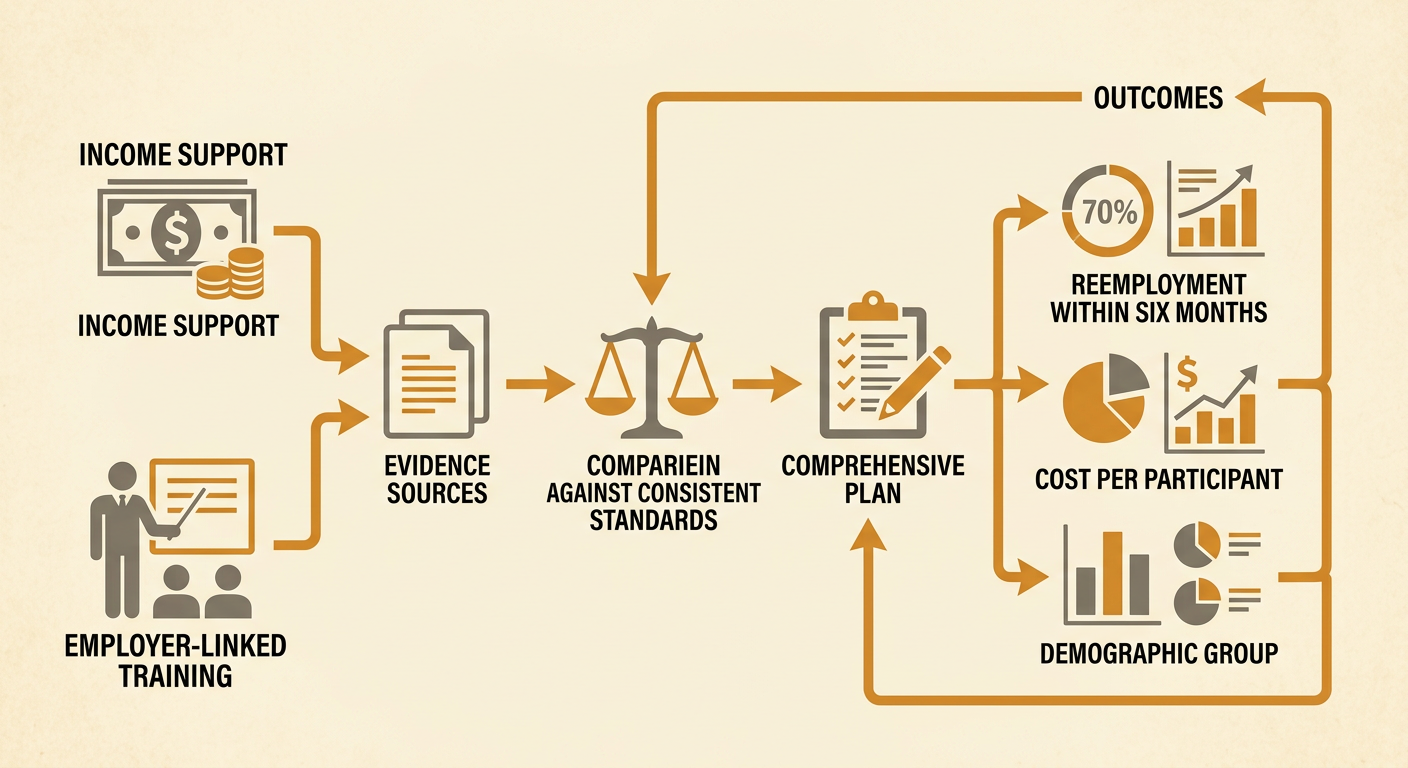
An evidence-based recommendation should combine quantitative data, credible research, stakeholder perspectives, and clearly stated values. Begin by defining criteria such as rapid income support, successful reemployment, equitable access, reasonable public cost, and adaptability as technology changes. Then compare policies using the same criteria and acknowledge uncertainty. For example, a state facing concentrated layoffs from automated freight systems could adopt a package of temporary unemployment benefits, employer-linked training, relocation or child care assistance, and short-term wage insurance. Funding could increase automatically when regional unemployment rises above a stated threshold. The state should track training completion, reemployment within six months, post-program wages, cost per participant, and results by demographic group. After a scheduled evaluation, officials could expand effective programs and revise weak ones. A strong recommendation explains why its expected benefits outweigh its trade-offs and identifies evidence that could change the conclusion.