Biodiversity and Ecosystem Resilience
Students analyze ecosystem evidence to explain how biodiversity can affect resilience following environmental disturbances and evaluate the influence of human land-use decisions.
Illustrations are auto-generated and may be placeholders. They can be refreshed to match the narration.
Defining Biodiversity and Resilience
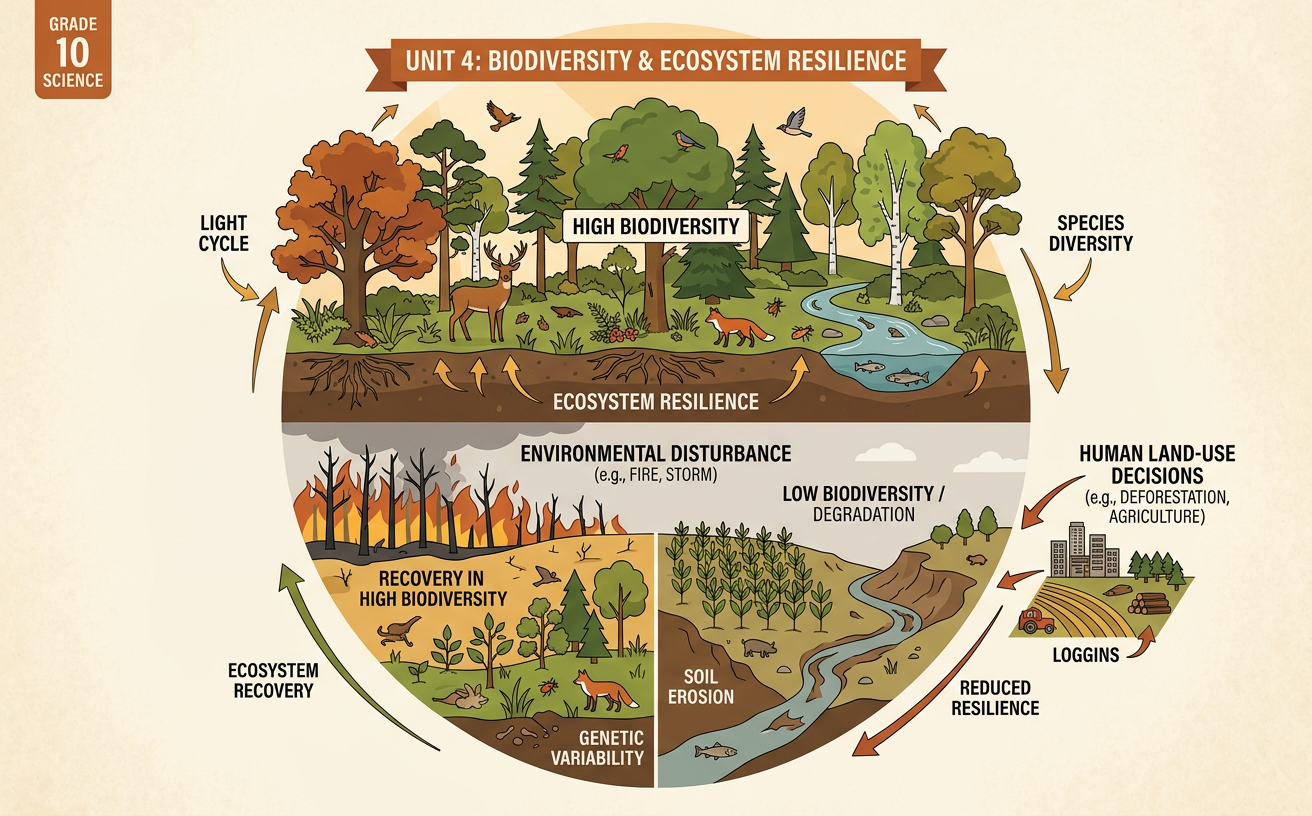
Biodiversity is the variety of life at several levels: genetic differences within a species, the number and relative abundance of species, and the variety of ecosystems across a region. Ecosystem resilience is the ability of an ecosystem to withstand a disturbance or recover its structure and functions afterward. Resistance, a related idea, describes how little an ecosystem changes during a disturbance. For example, a diverse prairie may contain grasses with different root depths and drought tolerances. During a dry year, shallow-rooted species may decline while deep-rooted species continue growing. This variety can help the prairie maintain soil cover and plant production. Biodiversity does not guarantee resilience, however. The severity of the disturbance, presence of invasive species, and condition of the soil also influence the outcome.

Comparing Ecosystem Disturbance Data
Scientists compare measurements taken before, during, and after a disturbance to evaluate resilience. Consider two equal-sized grassland plots exposed to the same drought. Before the drought, each plot produces 100 units of plant biomass. During the drought, the high-diversity plot falls to 70 units, while the low-diversity plot falls to 45 units. Two years later, the high-diversity plot reaches 95 units and the low-diversity plot reaches 65 units. These data suggest that the high-diversity plot had greater resistance and faster recovery. A sound comparison must also consider rainfall, soil type, grazing, plot size, and measurement methods. If these factors differ, biodiversity may not be the only explanation. Repeated trials and long-term observations make the conclusion more reliable.

Biodiversity and Recovery Patterns
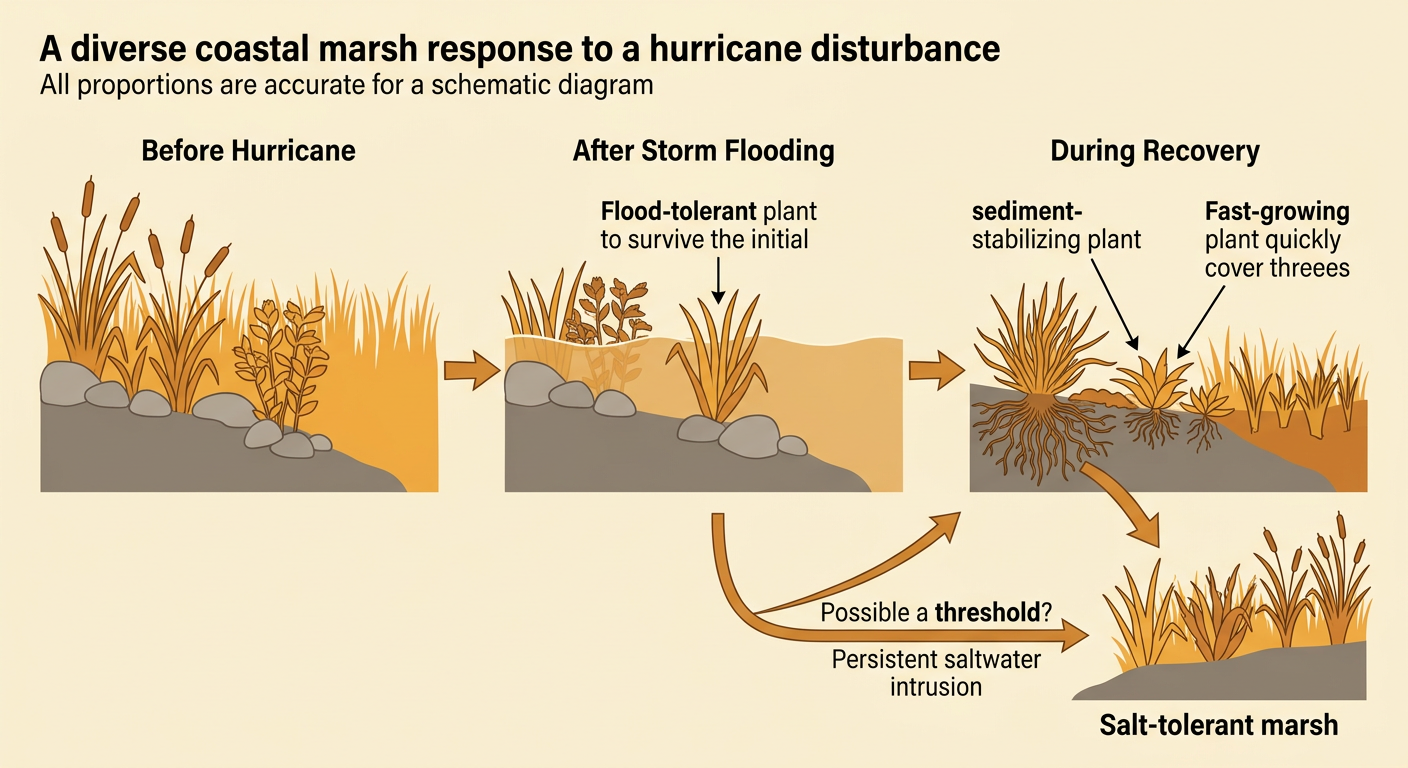
Biodiversity can support recovery because species perform different ecological roles and respond differently to stress. This variation is called response diversity. In a coastal marsh, for example, one plant species may tolerate flooding, another may stabilize sediment with dense roots, and another may grow quickly after storm damage. If a hurricane reduces one species, the others may continue photosynthesis, protect soil, and provide habitat. This functional overlap can keep important processes operating while populations recover. Recovery does not always mean returning to exactly the same species composition. If saltwater intrusion becomes permanent, a freshwater marsh may cross a threshold and shift into a salt-tolerant community. The new ecosystem may become relatively stable under the changed conditions. Scientists therefore track both the rate of recovery and whether the ecosystem returns to its earlier state.
Evaluating Claims and Evidence
A scientific claim should be supported by relevant evidence and reasoning that connects the evidence to ecological principles. Suppose a report claims, “Greater plant diversity caused faster drought recovery.” The report shows that a plot with 20 plant species recovered 30 percent more biomass than a plot with five species. This evidence is relevant, but it is not sufficient by itself. Students should ask whether the plots had similar soil, rainfall, grazing pressure, and starting biomass; whether the study included repeated plots; and whether the difference was statistically reliable. Strong reasoning might explain that species with different drought tolerances maintained ecosystem functions. However, if the diverse plot also received more water, the causal claim is weakened. A well-supported conclusion should acknowledge limitations and distinguish direct evidence of cause from a simple correlation.

Land-Use Decisions and Ecosystem Outcomes
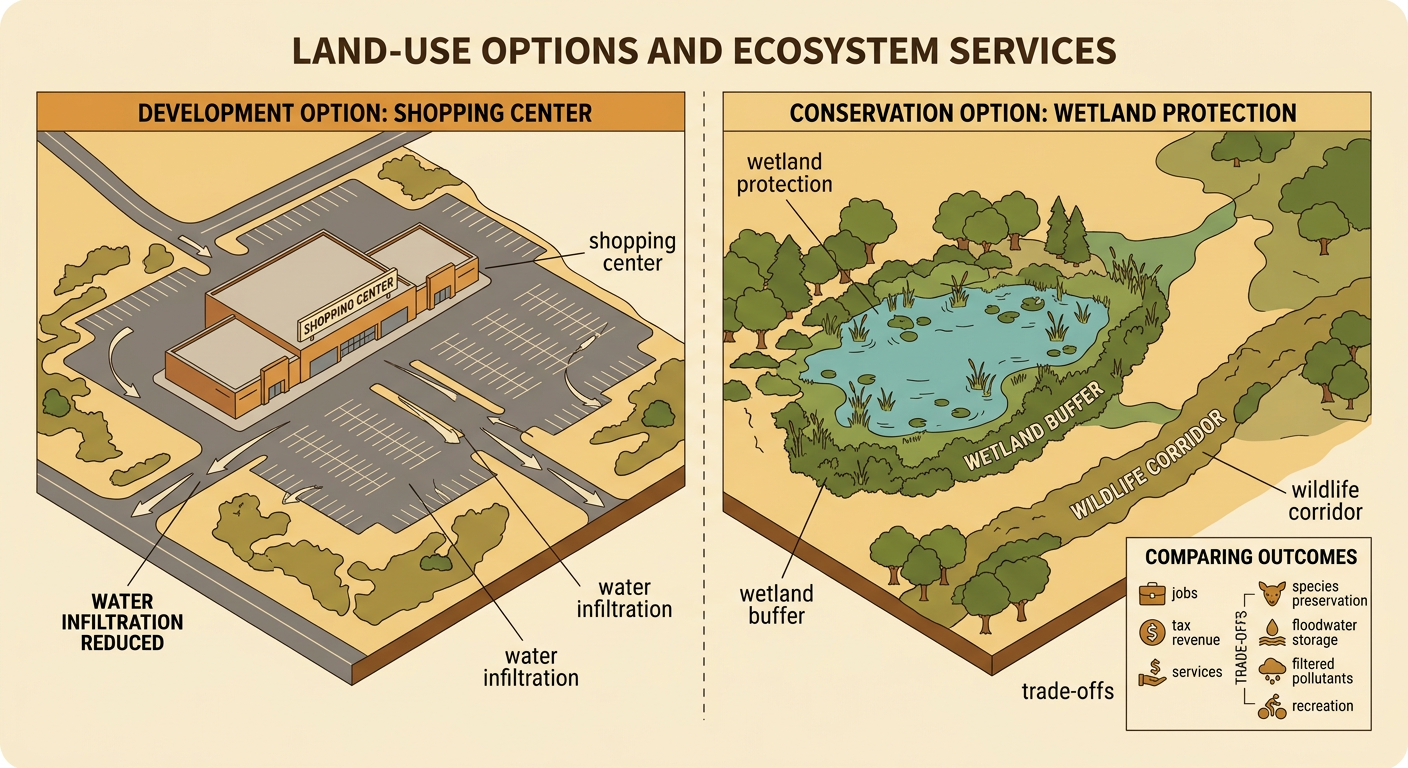
Land-use decisions can alter biodiversity, water flow, habitat connections, and an ecosystem's response to disturbance. Imagine a county deciding whether to protect a wetland or permit a shopping center. Development could create jobs, increase tax revenue, and provide services, but pavement would reduce water infiltration and divide wildlife habitat. Protecting or restoring the wetland could preserve species, store floodwater, filter pollutants, and support recreation. Political decisions determine zoning and environmental protections, while economic priorities influence which benefits and costs receive the most attention. Students can evaluate the options by comparing flood-risk maps, species surveys, construction revenue, restoration costs, and community testimony. A third option might allow limited development with wetland buffers and wildlife corridors. The strongest recommendation identifies trade-offs, considers who benefits or bears costs, and uses geographic and ecological evidence.