
Building a Randomized Simulation
Students use pseudocode, random numbers, loops, and counters to create and test a simulation of repeated chance events.

Illustrations are auto-generated and may be placeholders. They can be refreshed to match the narration.
Chance Events and Algorithms
A chance event has an outcome that cannot be known before it happens, although its possible outcomes can be listed. An algorithm is a precise sequence of steps for completing a task. A computer can combine an algorithm with random numbers to model a chance event. For example, suppose a game rolls two fair six-sided dice and wins when their sum is 7. The computer can choose one random integer from 1 through 6 for each die, add the values, and check the sum. If the sum is 7, it records a win; otherwise, it records a loss. Each pair of random numbers represents one trial. This algorithm does not predict a single roll. Instead, it allows us to repeat the event and study the pattern of results.

Planning the Simulation
Before writing code, clearly define the model, the event, and the data to collect. For the dice game, the model uses two independent random integers from 1 through 6 because one die should not affect the other. The event of interest is rolling a sum of 7. Choose a number of trials, such as 600, and plan counters for total trials, wins, and losses. Also decide how to report the result. Experimental probability can be calculated as wins divided by total trials. Planning helps prevent mistakes such as generating numbers from 0 through 6 or counting only one combination that makes 7. Valid winning pairs are 1 and 6, 2 and 5, 3 and 4, and the same pairs in reverse order.

Writing the Pseudocode
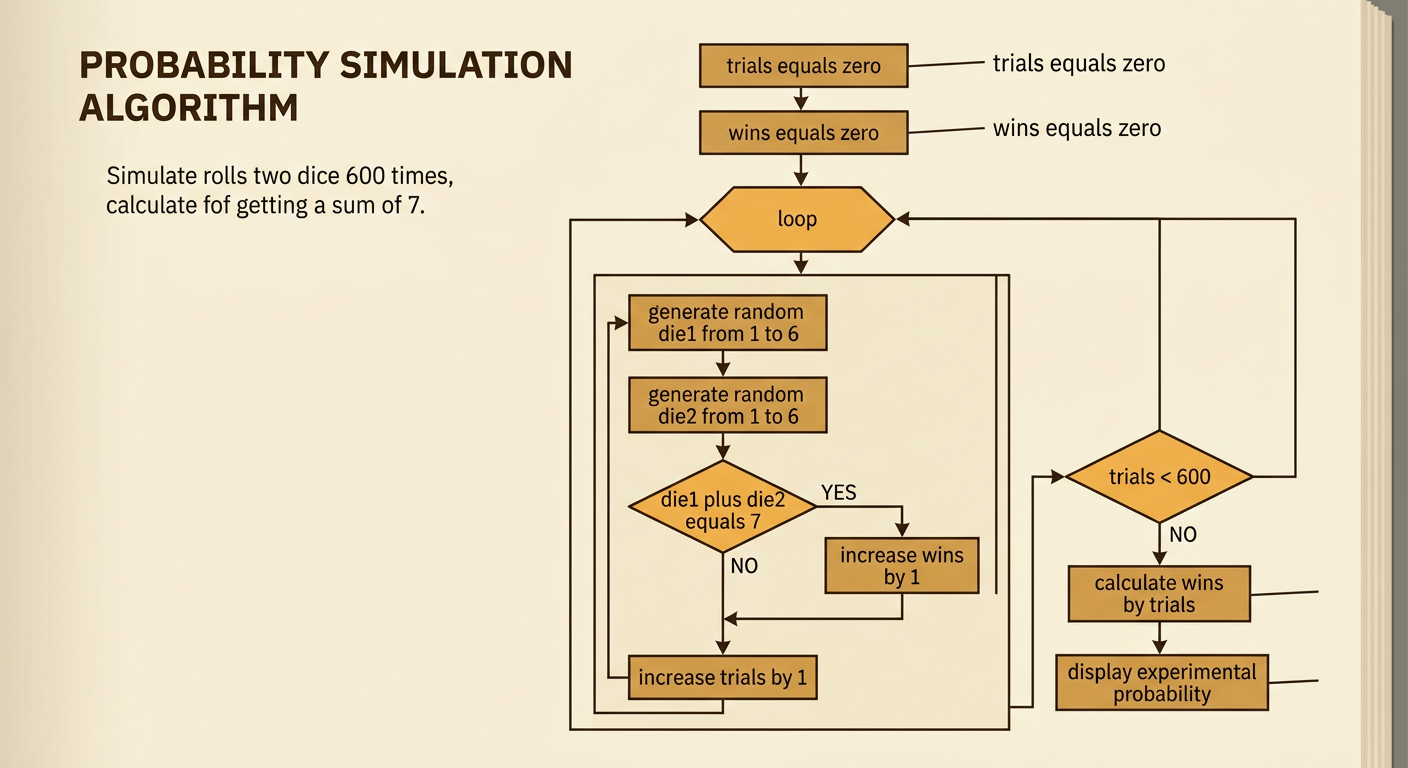
Pseudocode describes an algorithm in readable steps without requiring the exact rules of a programming language. Begin by setting the trial and win counters to zero. Then repeat the trial steps 600 times. During each repetition, set die1 to a random integer from 1 through 6 and set die2 the same way. Add the values. If die1 plus die2 equals 7, increase the win counter by 1. Always increase the trial counter by 1. After the loop ends, divide wins by trials and display the experimental probability. Indentation or a flowchart can show which instructions belong inside the loop and which instruction belongs inside the condition. Checking the order matters: the random values must be generated again during every repetition, not just once before the loop.
Running Repeated Trials
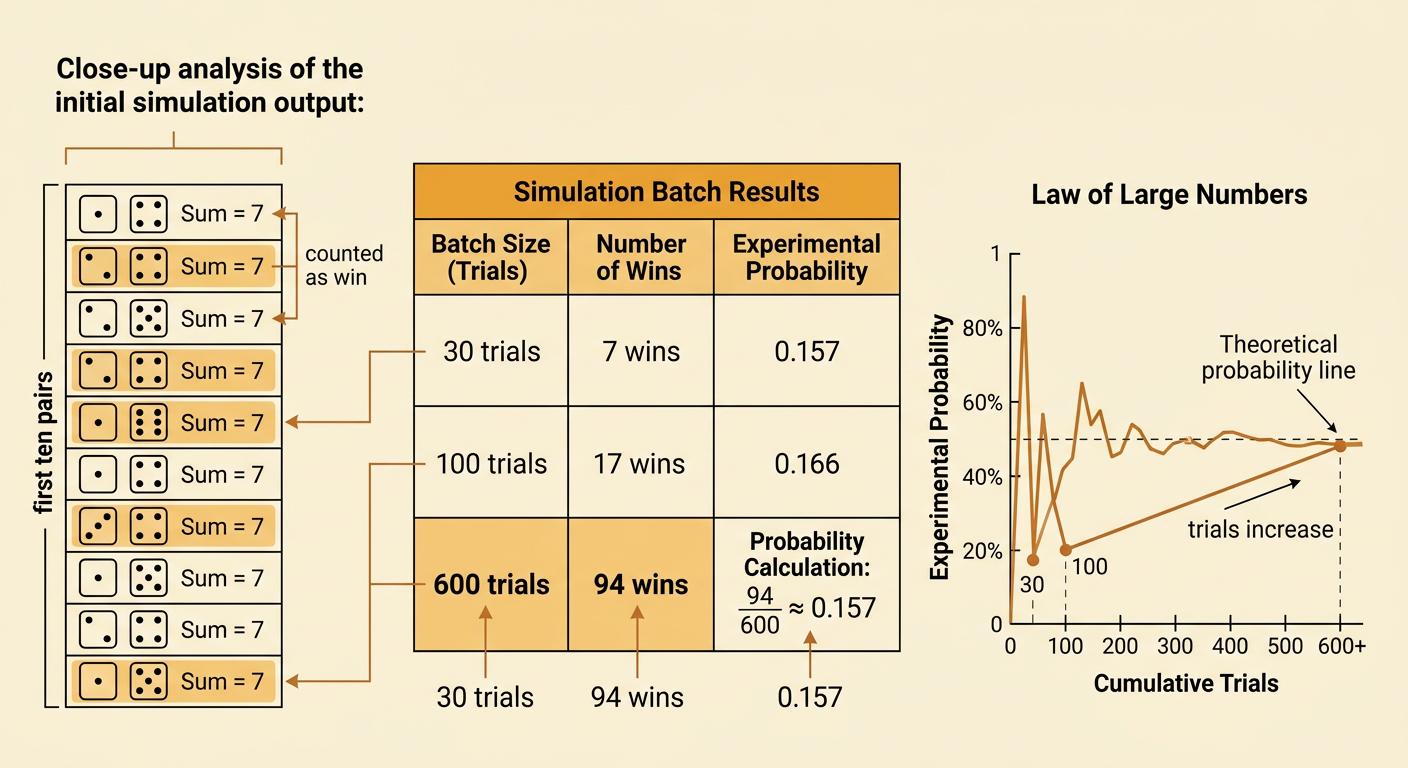
Running many trials produces data that can be summarized with counts and proportions. Suppose the simulation completes 600 trials and records 94 wins. The experimental probability is 94 divided by 600, or about 0.157. This means approximately 15.7 percent of the simulated rolls had a sum of 7. A second run might produce 108 wins because random simulations do not usually give identical results. Test the program in smaller batches before trusting a long run. For example, inspect the first ten pairs of values to confirm that every value is between 1 and 6 and that every sum of 7 is counted. Then run larger batches, such as 30, 100, and 600 trials. Recording each batch makes it easier to find coding errors and observe how results change as the sample grows.
Comparing Results with Predictions
Theoretical probability provides a prediction for comparison. Two dice have 36 equally likely ordered outcomes, and 6 of them have a sum of 7. Therefore, the theoretical probability is 6 divided by 36, or about 0.167. A simulation result of 94 wins in 600 trials gives about 0.157, which is close but not equal to the prediction. Chance creates variation, especially in small samples. For example, 8 wins in 30 trials gives about 0.267, a much larger difference. Results generally become more stable as the number of trials increases. Analyze the evidence from multiple perspectives: a player may focus on one short run, while a game designer may examine thousands of trials. If results stay far from the prediction, check the random-number range, independence of the dice, counters, and condition before drawing a conclusion.
