
Building Evidence-Based Arguments About Resource Use
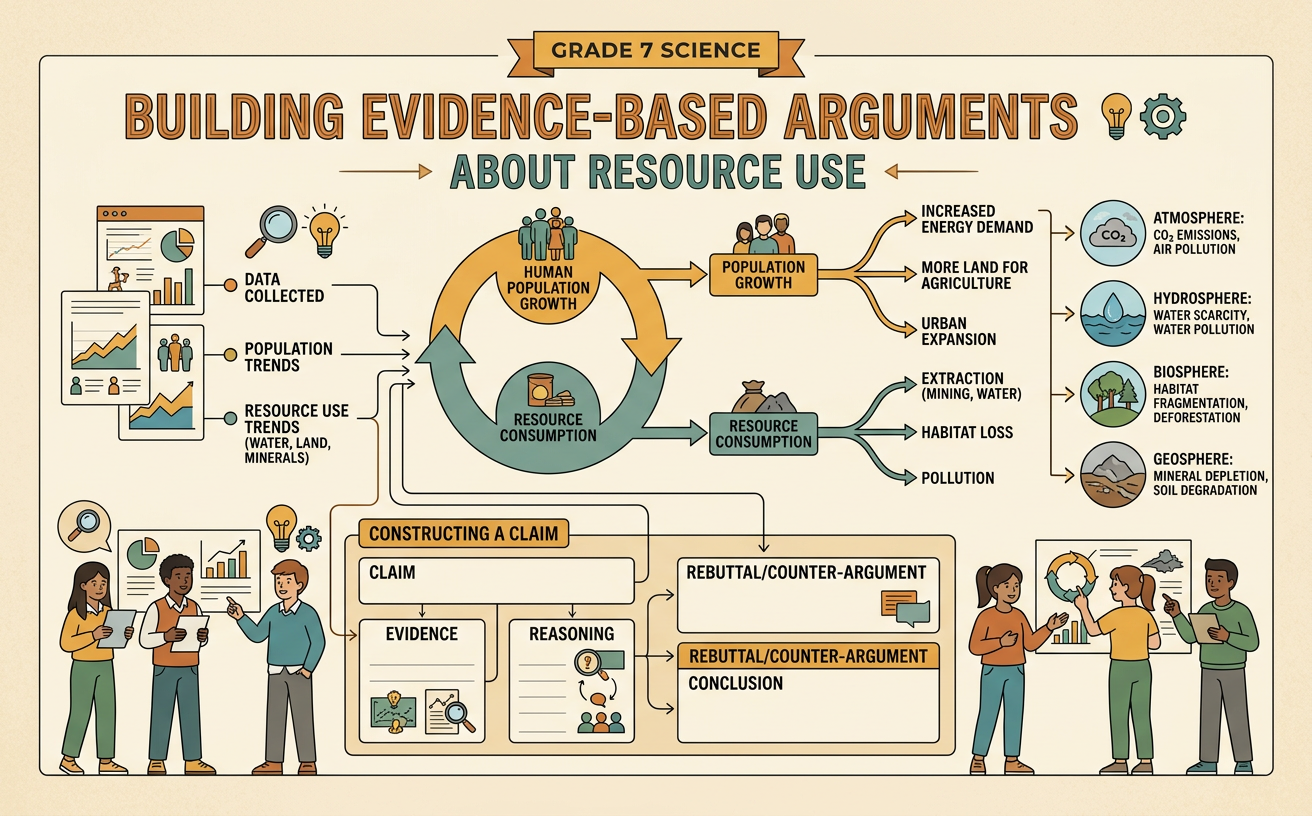
Students evaluate scientific evidence and construct a claim about how human population growth and resource consumption affect Earth’s systems.
Illustrations are auto-generated and may be placeholders. They can be refreshed to match the narration.
Population, Consumption, and Earth’s Systems
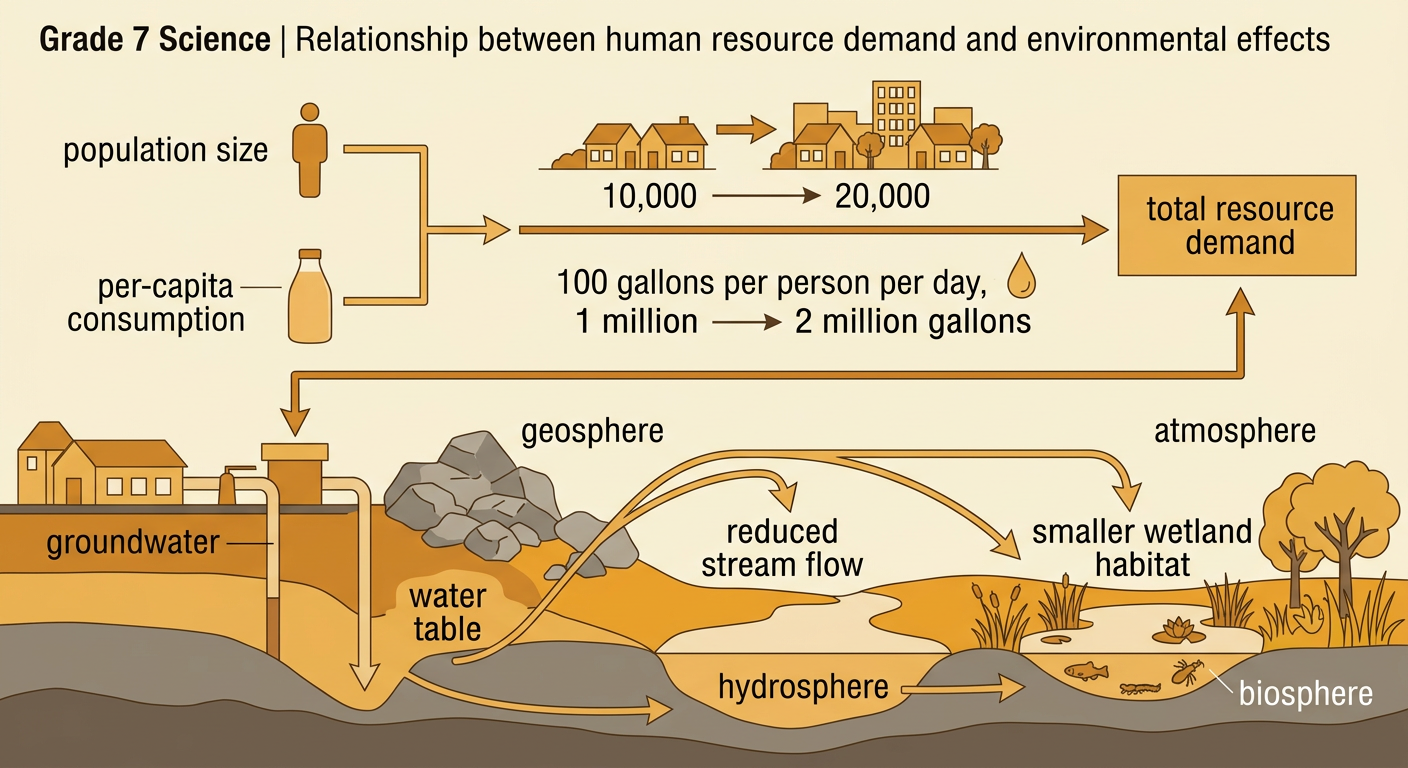
Human demand for natural resources depends on both population size and per-capita consumption, which means the average amount each person uses. When either factor increases, total resource use can rise. Greater use of water, timber, fossil fuels, soil, and minerals can affect Earth’s geosphere, hydrosphere, atmosphere, and biosphere. For example, imagine a town that grows from 10,000 to 20,000 residents. If each person uses 100 gallons of water per day, total daily use rises from 1 million to 2 million gallons. Pumping more groundwater than rainfall replaces can lower the water table, reduce stream flow, and shrink wetland habitats. However, conservation measures could reduce per-capita use. Population growth does not determine one unavoidable outcome; its impact also depends on consumption choices, technology, resource management, and local environmental conditions.
Reading a Resource-Use Scenario
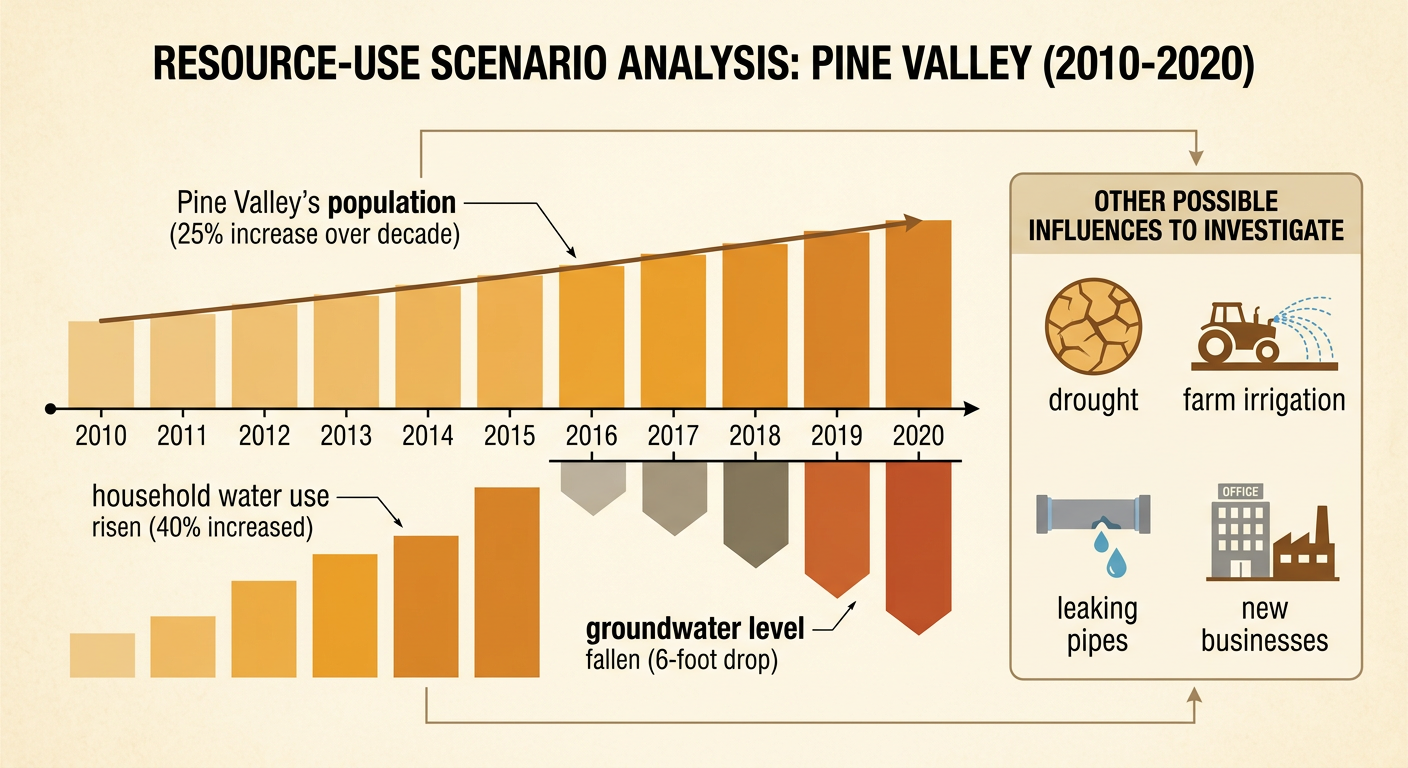
Begin by identifying the place, time period, resource, human activity, and environmental change described in a scenario. Consider this example: Between 2010 and 2020, Pine Valley’s population increased by 25 percent. A utility report states that household water use increased by 40 percent, while monitoring wells showed that the average groundwater level fell 6 feet. Read carefully before deciding what the evidence means. The data show that population, water use, and groundwater levels changed during the same period, but they do not prove that population growth was the only cause. Drought, farming, leaking pipes, or new businesses might also matter. Check who produced each source, how measurements were made, and whether the time periods match. Cite precise information, such as the 40 percent increase in household water use, rather than saying only that water use rose.
Identifying Relevant Evidence
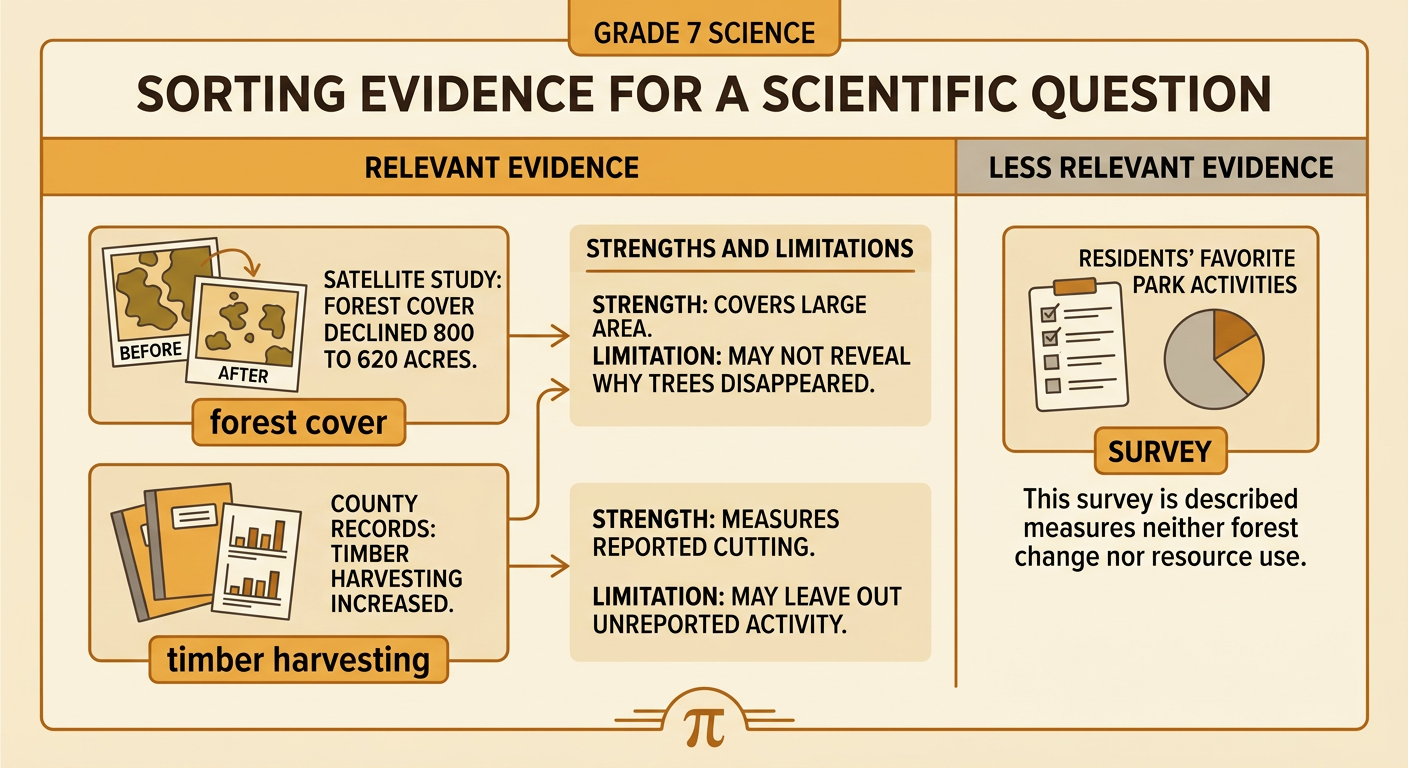
Relevant evidence directly helps answer the question and comes from a source suited to the claim. Suppose students are evaluating whether increased consumption has affected a nearby forest. A satellite study showing that forest cover declined from 800 to 620 acres is relevant. County records showing that timber harvesting increased during the same years are also relevant. A survey about residents’ favorite park activities is less relevant because it does not measure resource use or forest change. Evidence should also be evaluated for quality. Satellite images cover a large area but may not explain why trees disappeared. Harvest records measure reported cutting but could omit unreported activity. Evidence from several independent sources is usually stronger than one isolated fact. Students should record each source, quote or summarize its specific data accurately, and note limitations such as a short time period, small sample, or uncertain measurement.
Connecting Evidence to a Claim
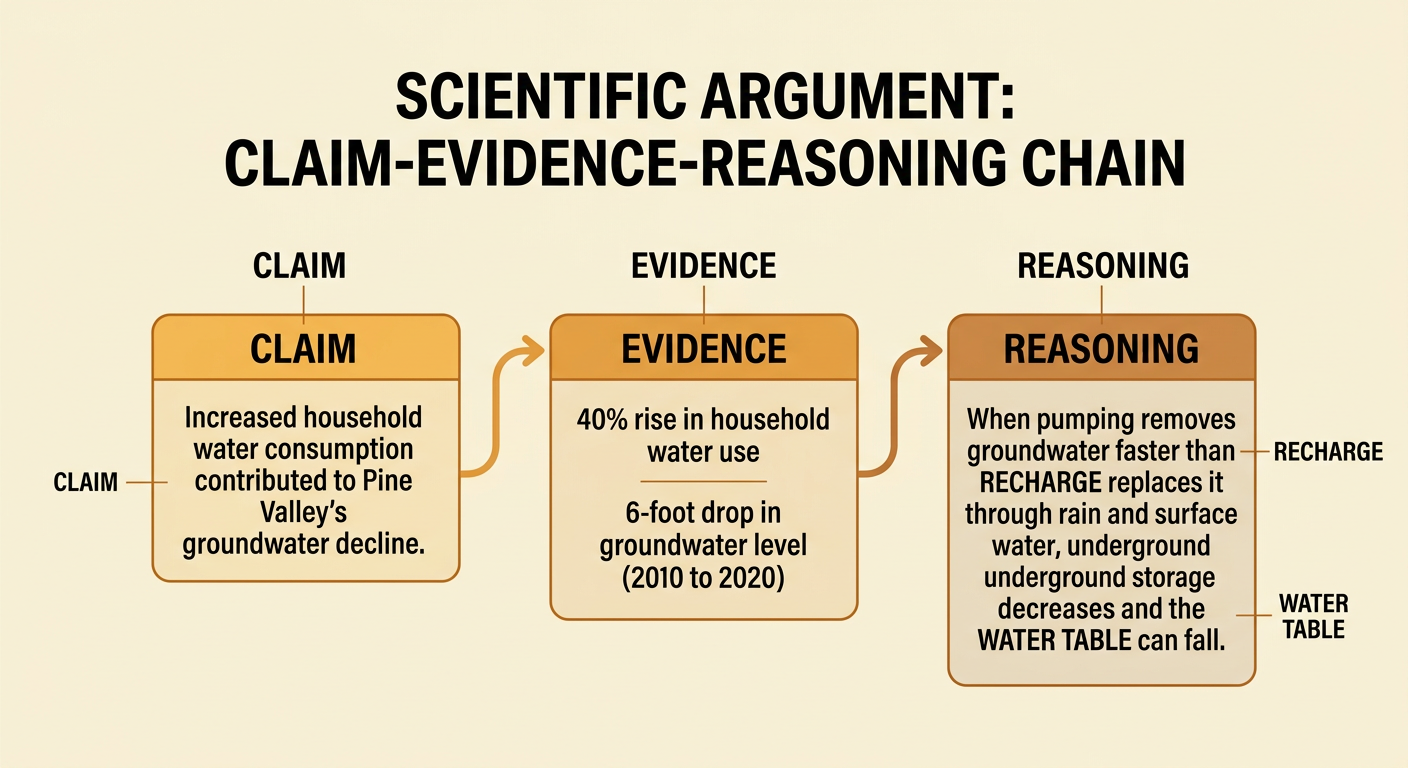
Evidence becomes persuasive when reasoning explains how it supports a claim. Use a claim-evidence-reasoning chain. A claim might state, “Increased household water consumption contributed to the decline of Pine Valley’s groundwater supply.” Evidence could include the 40 percent rise in household water use and the 6-foot drop in groundwater level from 2010 to 2020. The reasoning should connect the facts using science: when groundwater pumping exceeds recharge from rain and surface water, stored groundwater decreases and the water table can fall. Avoid simply repeating the numbers. Also avoid claiming that the evidence proves household use was the only cause. A careful argument might explain that the matching trends support the claim but that drought and agricultural pumping must also be examined. This reasoning makes the argument logical, scientifically accurate, and appropriately limited by the available evidence.
Constructing an Evidence-Based Argument
A complete argument includes a clear claim, evidence from multiple sources, scientific reasoning, and an acknowledgment of uncertainty or competing explanations. For example: “Population growth and rising per-capita water use likely contributed to Pine Valley’s groundwater decline.” Support this claim with the utility report, population records, and monitoring-well data. Explain that more residents using more water per person increases total demand, and pumping faster than recharge lowers groundwater storage. Then address a counterclaim, such as the idea that drought caused the entire decline. Rainfall records could strengthen or weaken that explanation. State source limitations: utility records may exclude private wells, and ten years of measurements may not show long-term patterns. End by proposing what additional evidence is needed. This structure creates a balanced argument because it uses specific facts, compares sources, explains their importance, and avoids claiming more certainty than the evidence allows.
