
Carbon on the Move: Modeling the Global Carbon Cycle
Students analyze carbon dioxide data and construct a systems model showing how photosynthesis, cellular respiration, combustion, and ocean exchange move carbon among Earth's major reservoirs.
Illustrations are auto-generated and may be placeholders. They can be refreshed to match the narration.
Launch: Where Is Earth's Carbon?
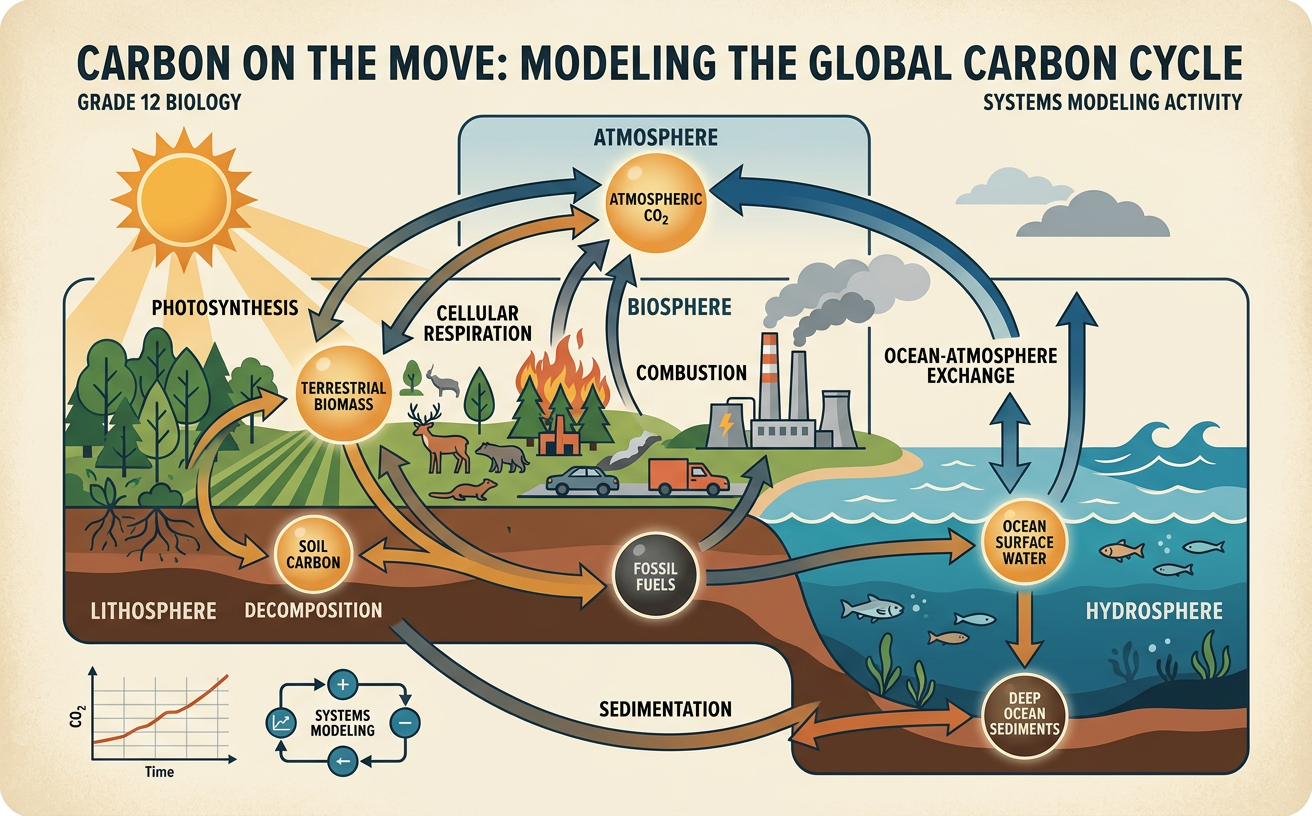
Carbon is stored throughout Earth, not only in the atmosphere. A carbon reservoir is a place where carbon remains for a period of time, while a carbon flux is the rate at which carbon moves between reservoirs. Sedimentary rocks contain the largest long-term carbon store. The deep ocean also holds far more carbon than the atmosphere, while soils, living organisms, and fossil fuels contain important smaller stores. Reservoir size does not determine how quickly carbon moves. For example, a tree may take carbon dioxide from the air within hours through photosynthesis, but carbon trapped in limestone may remain there for millions of years. As you examine the global carbon cycle, ask two questions: Where is carbon stored, and what processes transfer it from one location to another?

Identify Carbon Reservoirs
The major carbon reservoirs connect all four Earth systems. The atmosphere stores carbon mainly as carbon dioxide and methane. The biosphere stores carbon in organisms and organic matter. The hydrosphere stores dissolved carbon dioxide, bicarbonate ions, carbonate ions, and carbon in aquatic organisms. The geosphere stores carbon in soils, sediments, rocks, and fossil fuels. Reservoirs can overlap: soil belongs to the geosphere, but much of its carbon comes from once-living material. Scientists often measure reservoir size in gigatons of carbon, where one gigaton equals one billion metric tons. For example, a forest is a biosphere reservoir, but fallen leaves transfer some of its carbon into soil. Classifying reservoirs helps reveal how a change in one Earth system can affect the others.

Analyze Atmospheric Carbon Dioxide Data
Atmospheric carbon dioxide data are commonly reported in parts per million, or ppm. A value of 420 ppm means that about 420 of every one million dry-air molecules are carbon dioxide molecules. Measurements from Mauna Loa show an increase from about 315 ppm in 1958 to more than 420 ppm in recent years. Plotting monthly carbon dioxide concentration against time reveals two patterns: a long-term upward trend and a repeating seasonal cycle. The seasonal pattern is influenced strongly by Northern Hemisphere vegetation, which removes more carbon dioxide during spring and summer and releases carbon through respiration and decay during fall and winter. A scatterplot, trend line, or moving average can make the relationship clearer. For example, students can compare yearly averages, calculate the change in ppm, and describe the positive association between time and carbon dioxide concentration.

Model Carbon Transfers
A carbon-cycle model uses arrows to show transfers, and each arrow should be labeled with a process. During photosynthesis, plants and algae take in carbon dioxide and convert its carbon into sugars. Cellular respiration by producers, consumers, and decomposers returns carbon dioxide to air or water. Combustion rapidly transfers carbon from biomass or fossil fuels into the atmosphere. Ocean exchange moves carbon dioxide in both directions: gas dissolves into surface water, and dissolved carbon dioxide can return to the air. Some ocean carbon moves into deep water or sediments. Arrow width may represent the amount transferred per year, but the model must use one consistent scale. For example, carbon absorbed by a growing oak may later enter a deer, return through respiration, or move to soil when leaves fall and decompose.
Evaluate Human Impacts
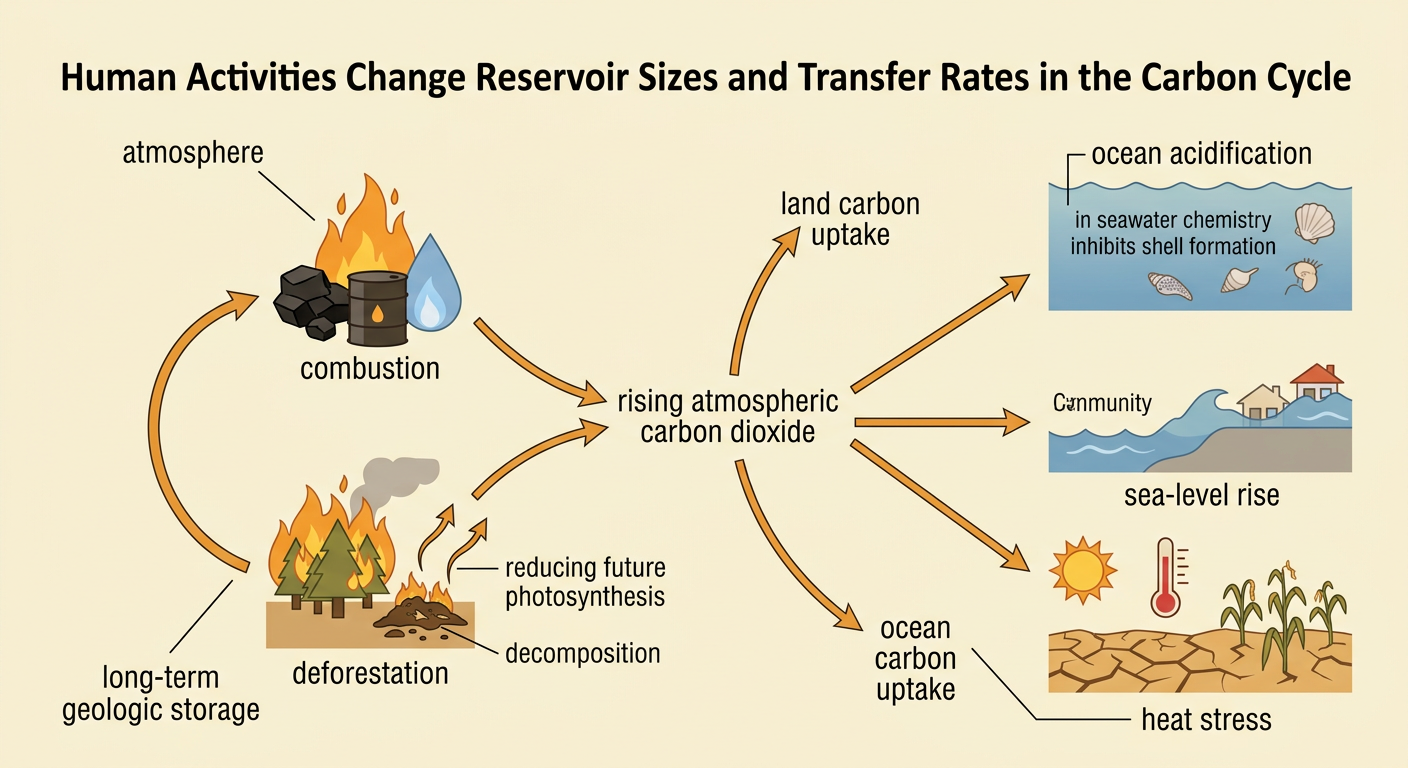
Human activities alter both the size of carbon reservoirs and the rates of carbon transfer. Burning coal, oil, and natural gas moves carbon from long-term geologic storage into the atmosphere much faster than natural processes replace those fuels. Deforestation releases carbon through burning and decomposition while reducing future photosynthesis. Land and ocean reservoirs absorb a substantial portion of human carbon dioxide emissions, but this uptake does not prevent atmospheric concentrations from rising. Increased ocean uptake also changes seawater chemistry and contributes to ocean acidification. These environmental changes affect human systems differently across locations. For example, a coastal community may face both sea-level rise and harm to shellfish industries, while a farming region may experience shifting rainfall or heat stress. Evaluation should include evidence, geographic differences, benefits, costs, and possible responses such as conserving forests and reducing fossil-fuel combustion.
Exit Check: Trace One Carbon Atom
To test your model, trace one carbon atom through at least four reservoirs and name every transfer process. Begin, for example, with a carbon atom in atmospheric carbon dioxide. Photosynthesis can move it into sugar in a grass plant. A rabbit may eat the grass, transferring the atom into animal tissue. Cellular respiration may return it to the atmosphere, or waste and death may move it into soil, where decomposition can release it later. Another valid pathway could carry the atom from the atmosphere into the surface ocean, then into a shell, sediment, and eventually limestone. Your explanation should distinguish reservoirs from processes and should not create or destroy the atom. Conclude by identifying one human activity that could change the rate of one transfer in your pathway.
