
Carrying Capacity: Limits on Population Growth
Students interpret population graphs and evidence to explain how resources, environmental conditions, and human decisions affect an ecosystem’s carrying capacity.
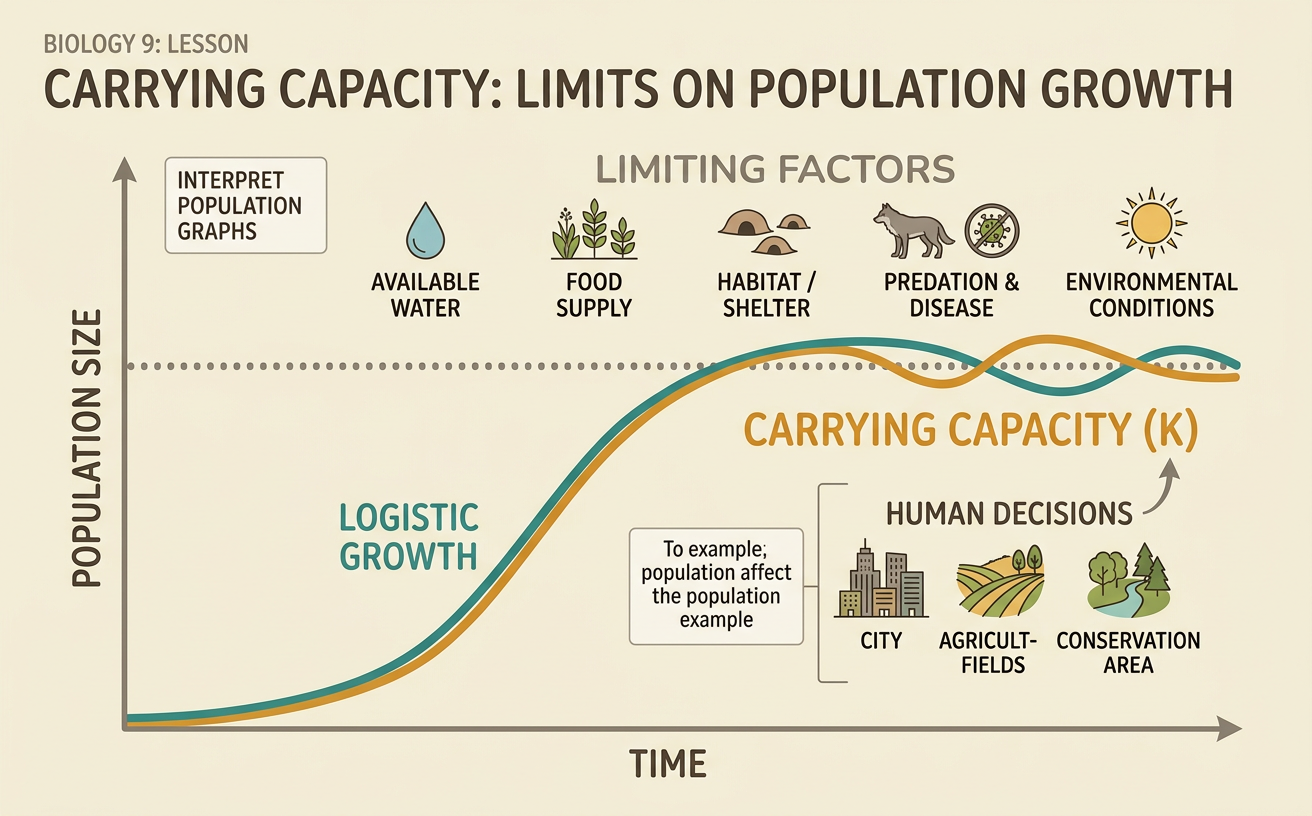
Illustrations are auto-generated and may be placeholders. They can be refreshed to match the narration.
Population Growth Patterns
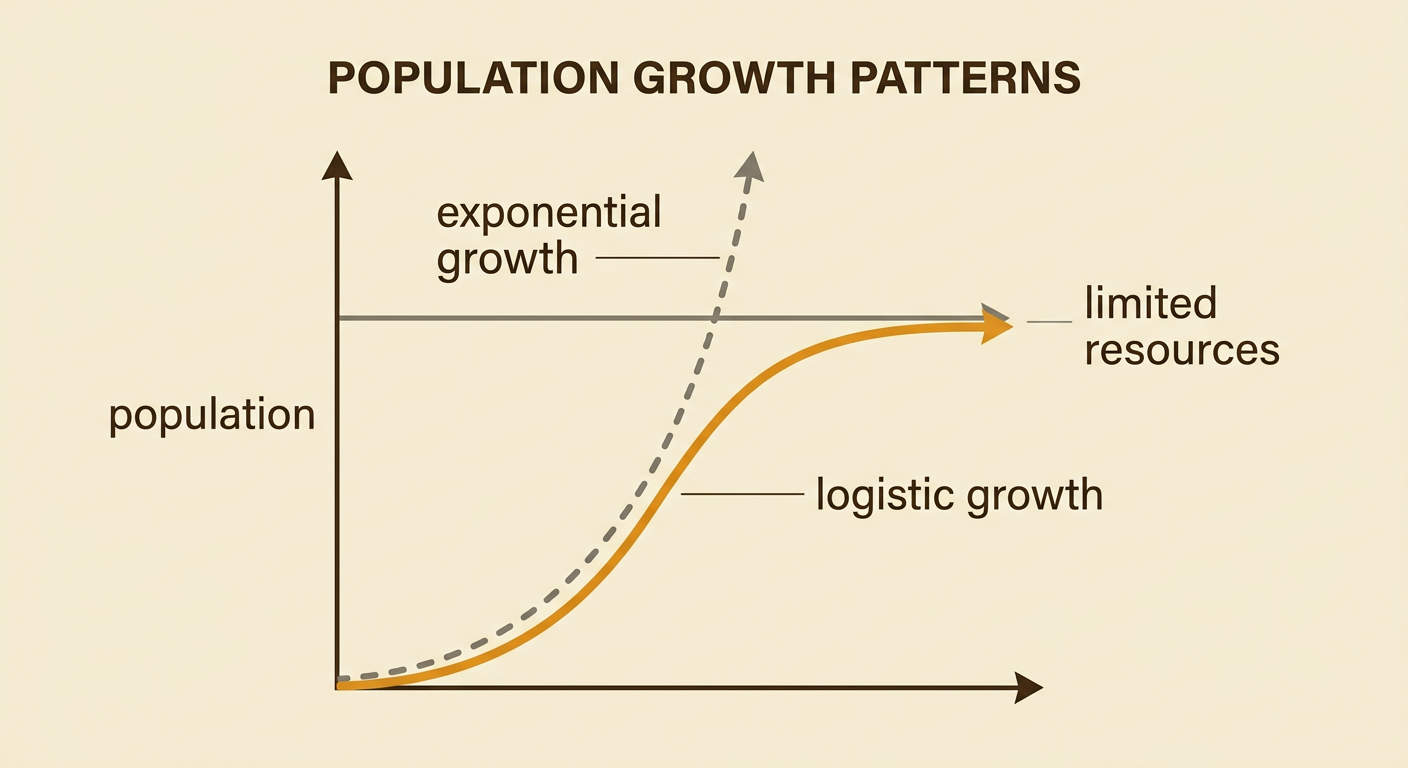
A population is a group of organisms of the same species living in one area. When resources are abundant, a population may grow exponentially: it increases by a larger amount during each time interval, creating a J-shaped graph. Exponential growth cannot continue forever because every ecosystem has limited space and resources. Growth often becomes logistic, producing an S-shaped graph. It begins rapidly, then slows as crowding and competition increase. For example, a small deer population may grow quickly when food and habitat are plentiful. As the number of deer rises, plants are eaten faster than they regrow. Birth rates may decrease, death rates may increase, and population growth slows. These patterns help scientists connect changes in population size to conditions in an ecosystem.
Defining Carrying Capacity
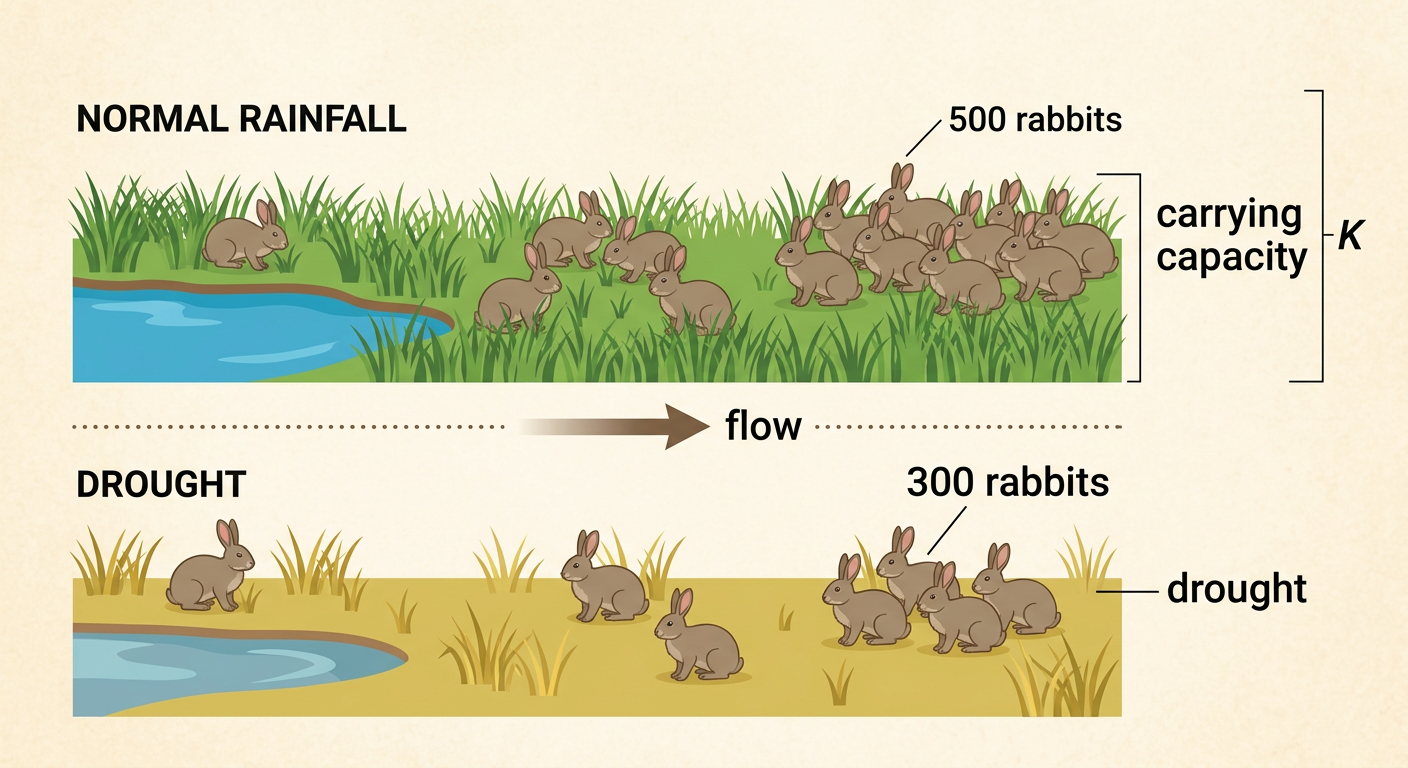
Carrying capacity is the largest population an environment can support over time without damaging the resources on which that population depends. It is often represented by the letter K. Carrying capacity is not a fixed property of a species or location. It can change when food, water, shelter, space, disease, climate, or interactions with other species change. It also depends on scale: a single pond may support hundreds of frogs, while an entire watershed may support many separate frog populations. Suppose a grassland normally provides enough food and water for about 500 rabbits. A long drought may reduce plant growth and lower the carrying capacity to 300 rabbits. Several wet years could restore vegetation and raise it again. Therefore, carrying capacity is an estimate based on current environmental conditions.
Limiting Factors
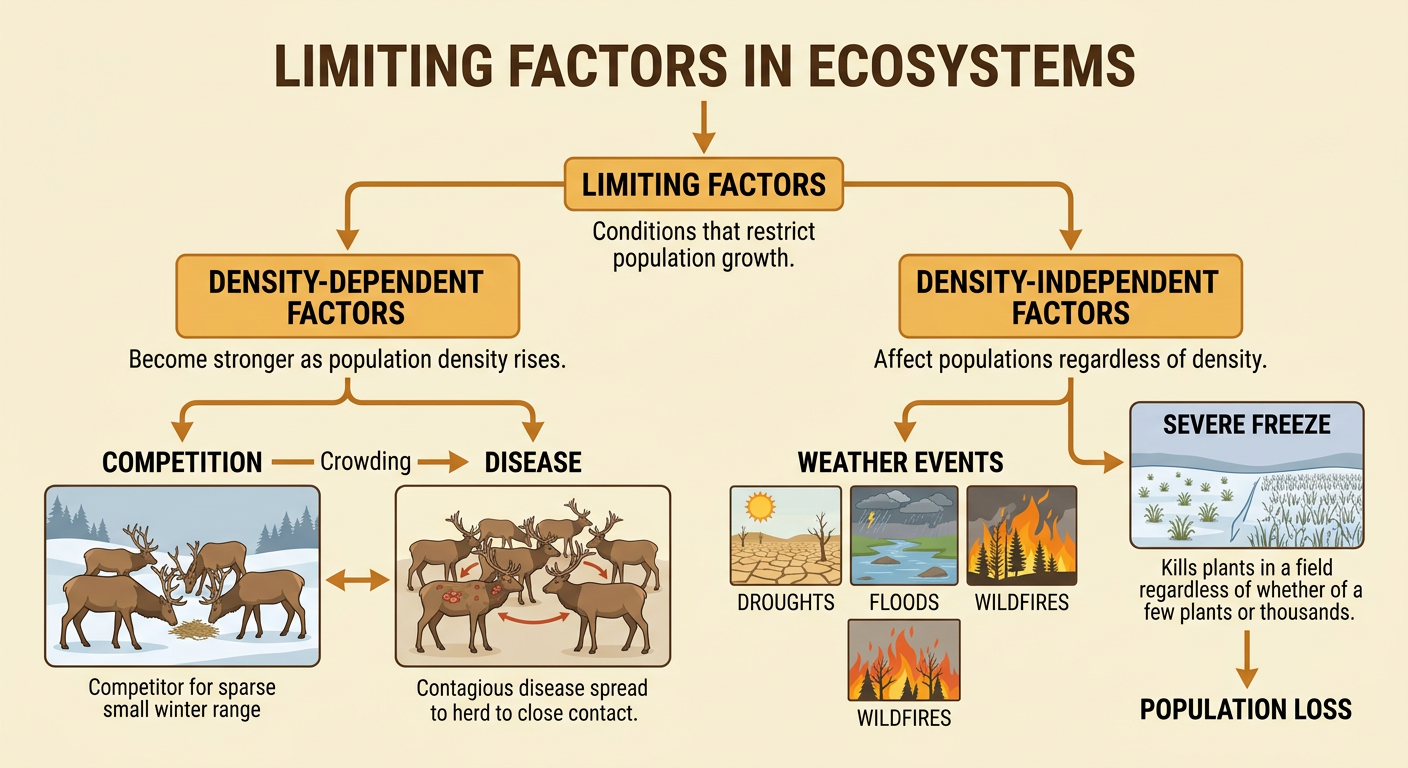
Limiting factors are conditions that restrict population growth. Density-dependent factors become stronger as population density increases. They include competition for food, disease, parasitism, and predation. For example, a contagious disease may spread more easily when many elk gather in a small winter range. Density-independent factors can affect populations regardless of their density. These include droughts, floods, wildfires, hurricanes, and sudden temperature changes. A severe freeze can kill plants whether a field contains a few plants or thousands. A limiting factor may reduce births, increase deaths, or cause organisms to leave an area. Several factors often act together. During a drought, less plant growth can increase competition among herbivores, weaken individuals, and make them more vulnerable to disease. Scientists examine multiple forms of evidence before identifying which factors are affecting carrying capacity.
Interpreting Population Graphs
To interpret a population graph, first read the title, axis labels, units, and scale. Next, identify where the population increases, decreases, or remains stable. The slope shows the rate of change: a steep upward segment indicates rapid growth, while a horizontal segment indicates little net change. On a logistic growth graph, the population often fluctuates near a carrying capacity line. It may temporarily overshoot that level and then decline because resources were depleted. For example, an island deer population might rise from 200 to 900 animals after predators are removed, even though the estimated carrying capacity is 700. If food becomes scarce, the population may fall below 700 before stabilizing. The graph does not prove the cause, so it should be interpreted alongside evidence about rainfall, vegetation, predators, disease, or human activity.

Human Decisions and Ecosystems
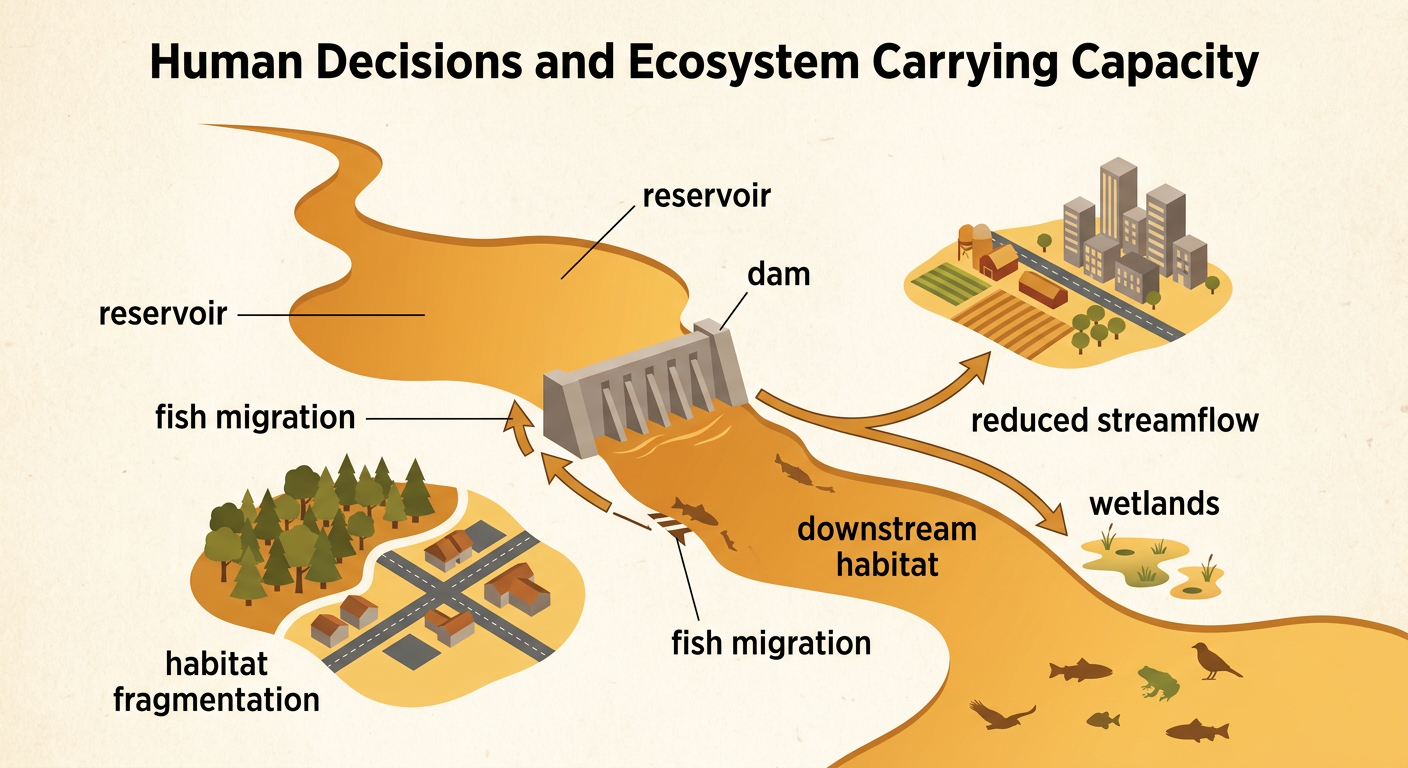
Human political and economic decisions can change resources and environmental conditions, affecting carrying capacity across places and regions. Building a dam may provide electricity and irrigation, but it can also change water temperature, sediment movement, and fish migration. These changes may lower the carrying capacity for native fish downstream while increasing opportunities for some reservoir species. Land-use policies can protect forests or allow development that fragments habitat. Economic demand for timber, crops, housing, or recreation can influence which option leaders choose. For example, a city may divert river water to farms and homes. The decision benefits people economically, but reduced streamflow may shrink wetland habitat and support fewer frogs, fish, and birds. Evaluating such a decision requires comparing ecological evidence with its social and economic benefits, costs, and distribution among communities.
Evidence-Based Explanation
An evidence-based explanation connects a claim to relevant data through scientific reasoning. Begin with a claim about what affected carrying capacity. Then cite quantitative evidence from graphs, tables, maps, or field observations. Finally, explain how the evidence supports the claim using ideas about resources and limiting factors. Suppose a lake’s algae population leveled near 10,000 cells per milliliter, but after fertilizer runoff increased, it leveled near 18,000. Water tests also showed higher nitrate concentrations. A supported claim is that added nutrients temporarily increased the lake’s carrying capacity for algae. The evidence is the rise in both nitrate concentration and the population’s stable level. The reasoning is that nitrate is a resource algae need for growth. A complete explanation should also address uncertainty and alternatives, such as changes in temperature, light, grazing organisms, or measurement methods.
