Carrying Capacity Under Pressure
Students analyze population data to determine how resource availability and human land use affect an ecosystem’s carrying capacity.
Illustrations are auto-generated and may be placeholders. They can be refreshed to match the narration.
Carrying Capacity Basics
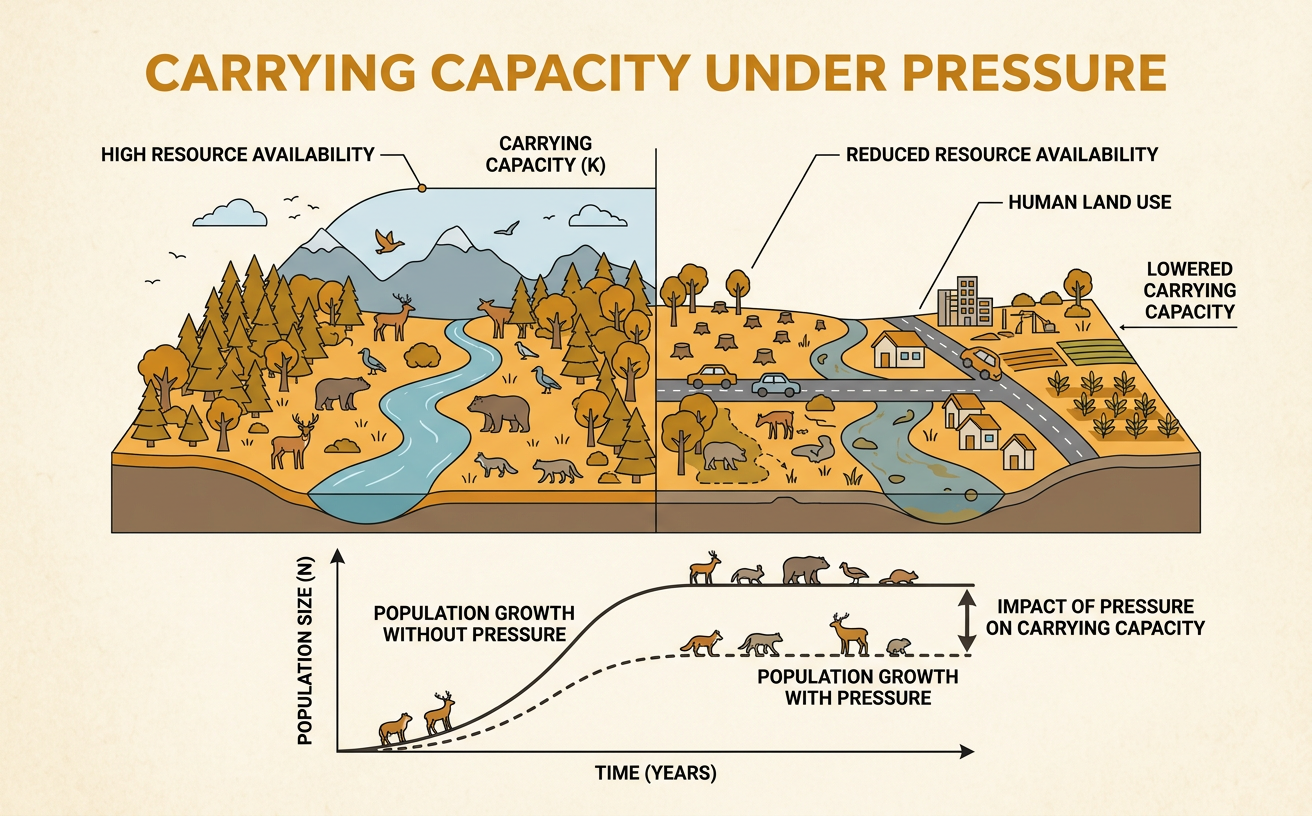
Carrying capacity is the largest population of a species that an ecosystem can support over time with its available resources and environmental conditions. It is often represented by the symbol K. Carrying capacity is not a fixed number because food, water, shelter, disease, climate, and habitat quality can change. When a population is well below K, abundant resources may allow rapid growth. As the population approaches K, competition increases and growth usually slows. A population may briefly exceed K, but resource depletion can then cause a decline. For example, a grassland might normally support about 400 deer. After several rainy years, greater plant growth could raise the carrying capacity. During a later drought, reduced vegetation and water could lower it, leaving the same deer population above the new sustainable level.

Reading a Population Graph
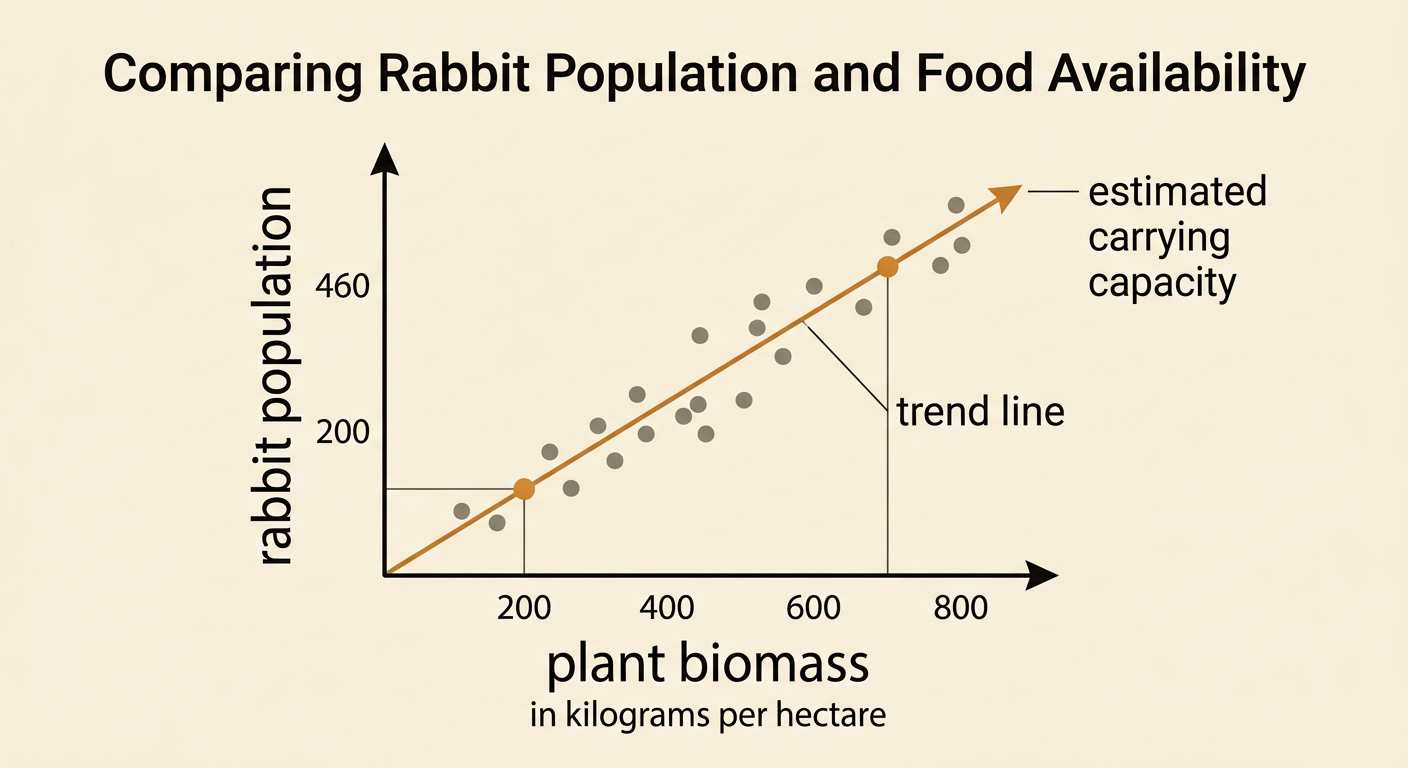
A population graph shows how population size changes over time, while a scatter plot can compare population size with a possible cause such as food availability. Begin by reading both axes, units, scale, and time interval. Then identify trends, peaks, declines, and unusual data points. A horizontal reference line may show estimated carrying capacity. For example, suppose a rabbit population rises from 120 to 460 as plant biomass increases from 200 to 700 kilograms per hectare. A scatter plot of these paired values would show a positive association: sites with more plant biomass generally have more rabbits. However, association does not prove that plant biomass is the only cause. Predators, disease, water, and sampling error may also affect rabbit numbers. A trend line can summarize the relationship and help estimate expected population size at a given resource level.
Limiting Factors
A limiting factor is any biotic or abiotic condition that restricts population growth or lowers carrying capacity. Biotic factors include food, competition, predation, and disease. Abiotic factors include water, temperature, soil nutrients, fire, and available space. Some limiting factors are density dependent, meaning their effects become stronger as population density rises. Disease and competition often work this way because crowded organisms interact more frequently and share fewer resources. Other factors, such as hurricanes or severe freezes, may affect populations regardless of density. For example, algae in a pond may grow rapidly when sunlight and nitrogen are abundant. If phosphorus becomes scarce, growth slows even though other resources remain available. A later heat wave may reduce dissolved oxygen, causing fish deaths. Because limiting factors can interact, scientists compare multiple variables before explaining a change in carrying capacity.

Human Land-Use Impacts
Human land use can alter resources, habitat area, and connections among habitats, thereby changing carrying capacity. Building roads and neighborhoods may remove feeding or nesting sites and divide one habitat into isolated fragments. Agriculture can provide food for some species, but pesticide use, water withdrawals, and loss of native vegetation may reduce other populations. These influences are reciprocal: people change physical and biological systems, and ecosystem changes can affect human livelihoods, health, and safety. For example, converting wetlands into commercial development reduces breeding habitat for frogs and decreases the wetland’s capacity to store floodwater. The frog carrying capacity falls because shelter, food, and egg-laying sites decline. At the same time, nearby communities may experience greater flooding. Restoring part of the wetland and creating vegetated corridors could increase usable habitat, support larger wildlife populations, and reduce flood risk for people.

Evidence-Based Ecosystem Claim
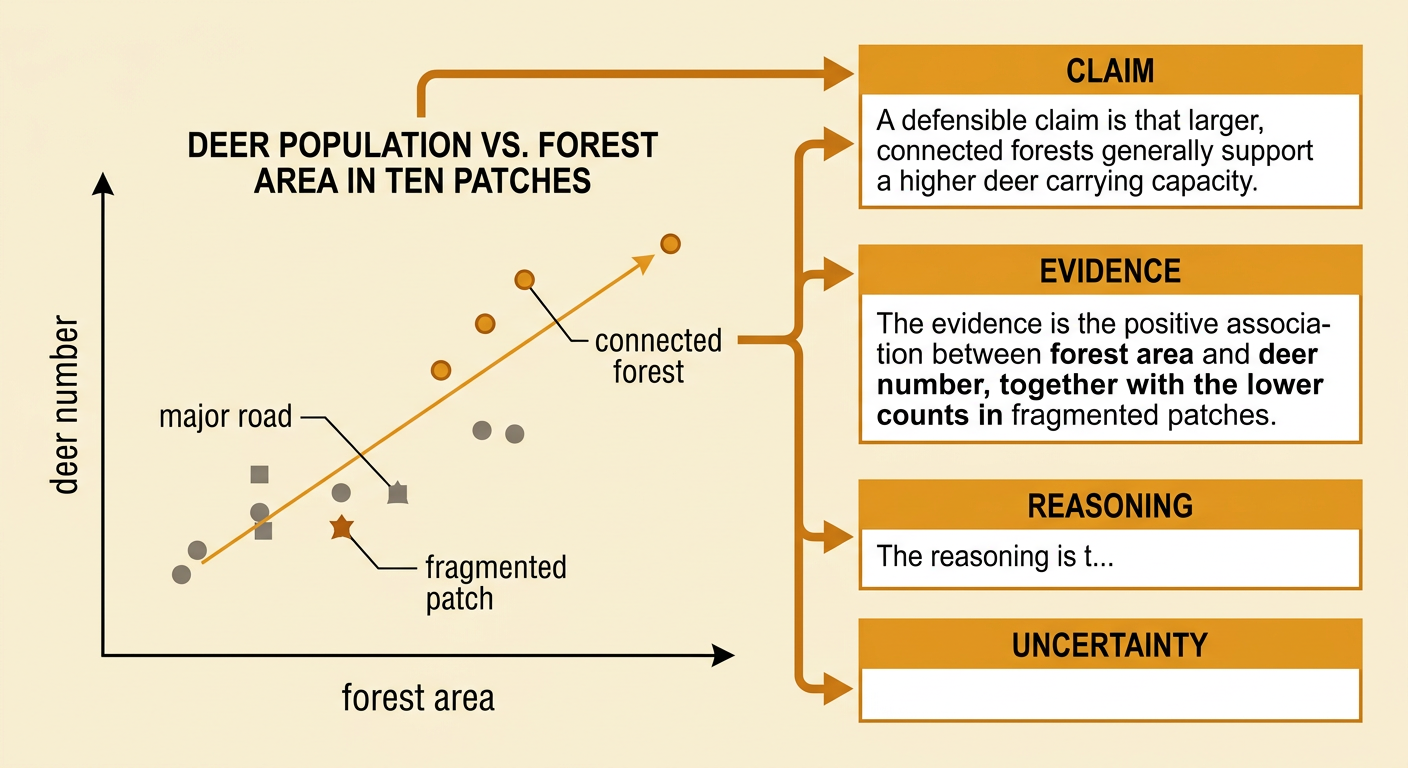
An evidence-based ecosystem claim answers a question using data, mathematical reasoning, and ecological principles. Start with a clear claim about how a factor affects carrying capacity. Then cite specific evidence, such as population counts, habitat area, resource measurements, or a scatter plot’s direction and strength. Finally, explain why the evidence supports the claim and acknowledge reasonable alternatives or uncertainty. For example, data from ten forest patches may show that deer density increases as forest area increases, while patches crossed by major roads have fewer deer than similarly sized connected patches. A defensible claim is that larger, connected forests generally support a higher deer carrying capacity. Evidence includes the positive association between area and deer number and the lower counts in fragmented patches. Reasoning connects these patterns to greater food, shelter, and movement space. The conclusion should remain cautious because hunting, predators, weather, or measurement differences could also influence the observed populations.