Carrying Capacity Under Pressure
Students analyze population and resource data to explain how environmental limits and human land-use decisions affect an ecosystem’s carrying capacity.

Illustrations are auto-generated and may be placeholders. They can be refreshed to match the narration.
Defining Carrying Capacity
Carrying capacity is the largest population of a species that an environment can support over time without degrading the resources and conditions that population needs. It is not a fixed number. Rainfall, food production, habitat area, disease, competition, and human activity can all change it. Imagine a grassland that usually supports about 600 prairie dogs. During several years with normal rainfall, births and deaths balance near that level. If the population temporarily rises to 750, food shortages may lower reproduction and increase deaths, bringing the population back down. However, a drought could reduce plant growth and lower the carrying capacity to 400. Carrying capacity describes a long-term environmental limit, not simply the highest population ever observed.

Limiting Factors in Ecosystems
A limiting factor is any resource or condition that restricts population growth. Density-dependent factors become stronger as population density rises; examples include competition, disease, predation, and the spread of parasites. Density-independent factors, such as wildfire, flood, drought, or a severe freeze, can affect populations regardless of density. Consider deer in a forest. When deer become numerous, they compete more intensely for shrubs and young trees, so fewer individuals survive or reproduce. A hurricane, in contrast, may destroy habitat whether the forest contains 50 deer or 500. Human actions can also create limits. Roads divide habitat, farms replace native vegetation, and water withdrawals reduce streams and wetlands. Because factors interact, ecologists evaluate food, water, shelter, space, climate, and human land use together rather than assuming that one factor controls the population.

Reading Population and Resource Data
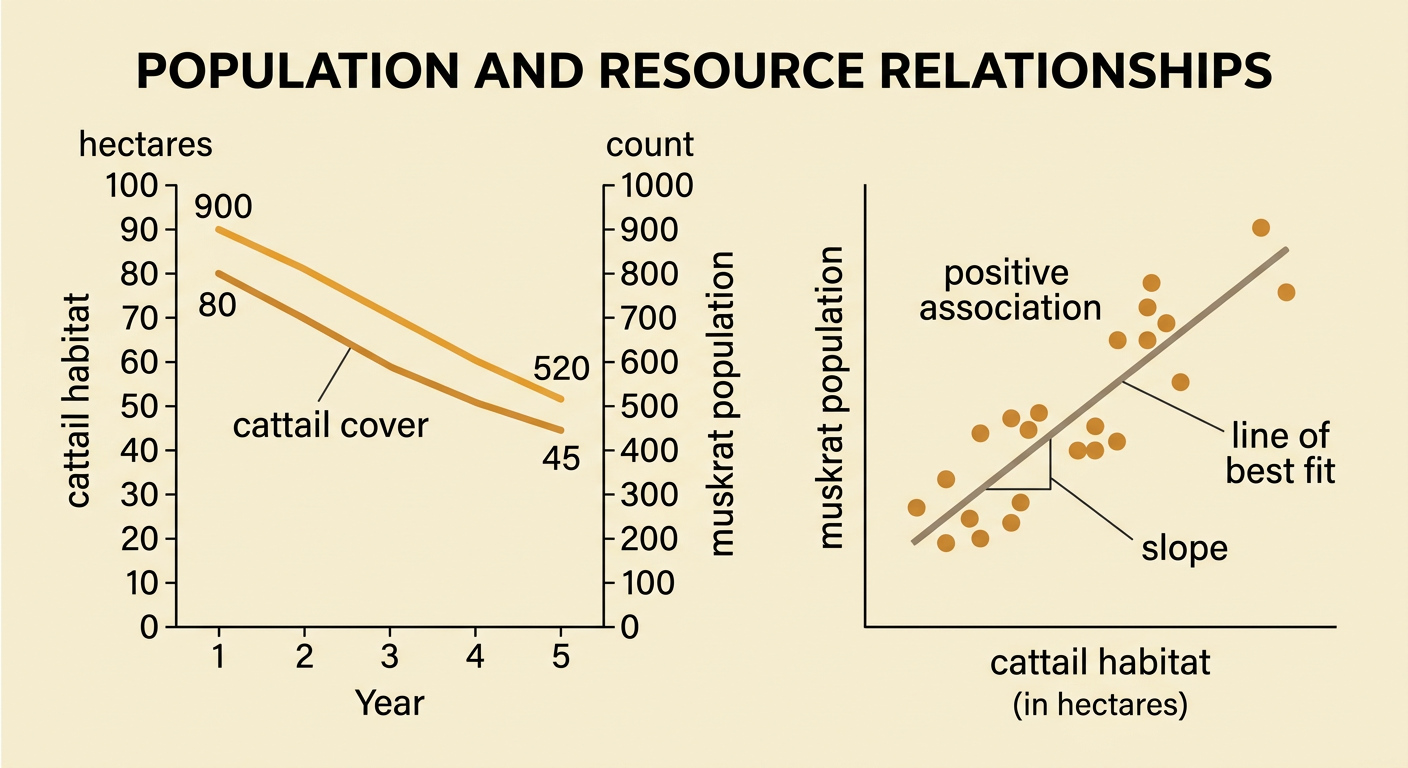
Graphs and tables help reveal relationships between population size and available resources. First identify each variable, its units, and the time period. Then examine trends, peaks, delays, and unusual values. Suppose a wetland survey shows that cattail cover falls from 80 hectares to 45 hectares over five years while the muskrat population declines from 900 to 520. A scatterplot would likely show a positive association: years with more cattail habitat tend to have more muskrats. A line of best fit can summarize the relationship, while its slope estimates the population change associated with each hectare of cattails. However, correlation alone does not prove that cattail loss caused the decline. Water depth, disease, trapping, and survey methods could also matter. Strong explanations combine the quantitative pattern with ecological evidence and information about data quality.
Modeling a Land-Use Change
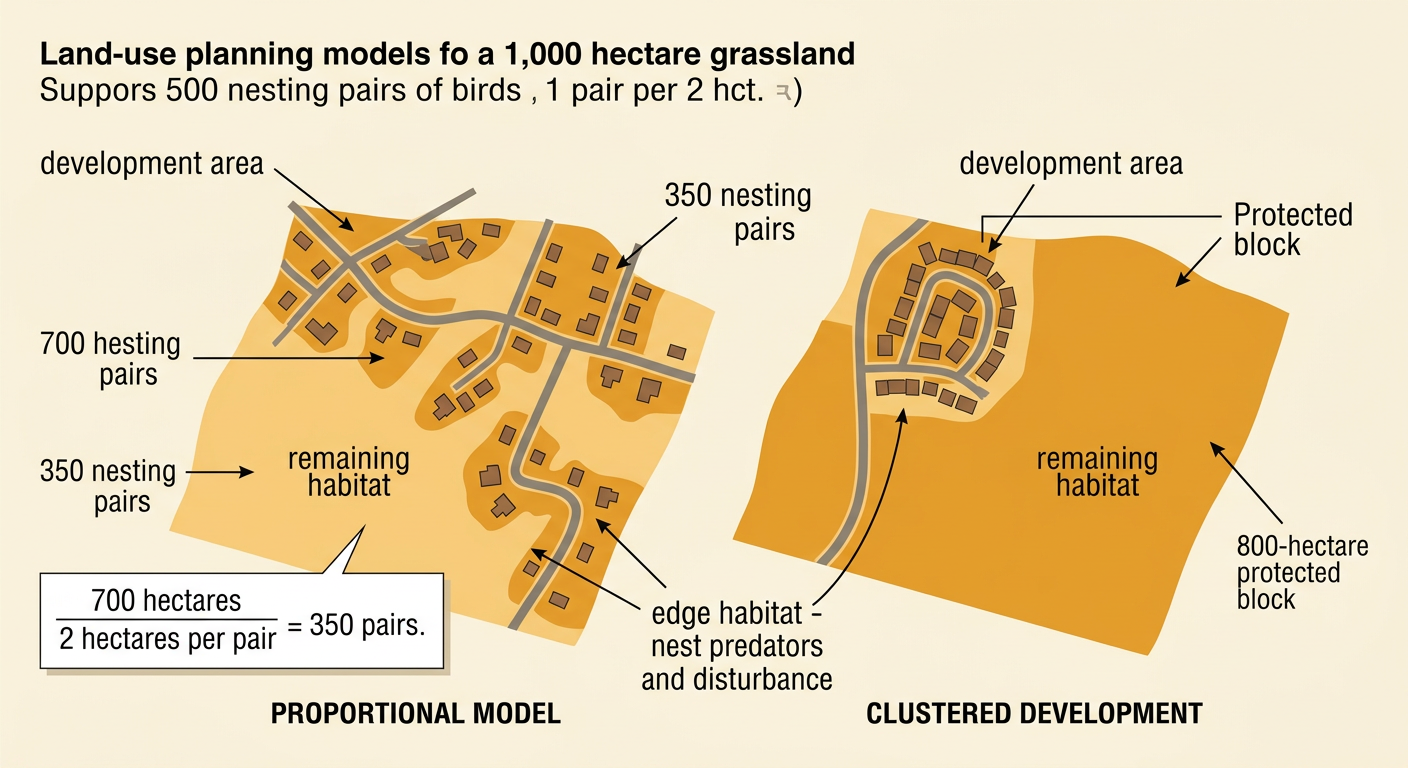
A model can estimate how a proposed land-use decision may affect carrying capacity. Suppose a 1,000-hectare grassland supports 500 nesting pairs of a bird, or about one pair per two hectares of suitable habitat. A development plan would convert 300 hectares into housing and roads, leaving 700 hectares. If habitat quality remained equal, a simple proportional model would estimate a new capacity of 350 pairs: 700 divided by 2. This estimate is a starting point, not a guarantee. Roads may fragment the remaining grassland, increase nest predators, and create noisy edge habitat, so the actual capacity could be lower. A clustered development plan that protects one continuous 800-hectare block might support more pairs than scattered construction that leaves the same total area. Political zoning choices and economic goals therefore influence ecological outcomes.
Evidence-Based Ecosystem Recommendation
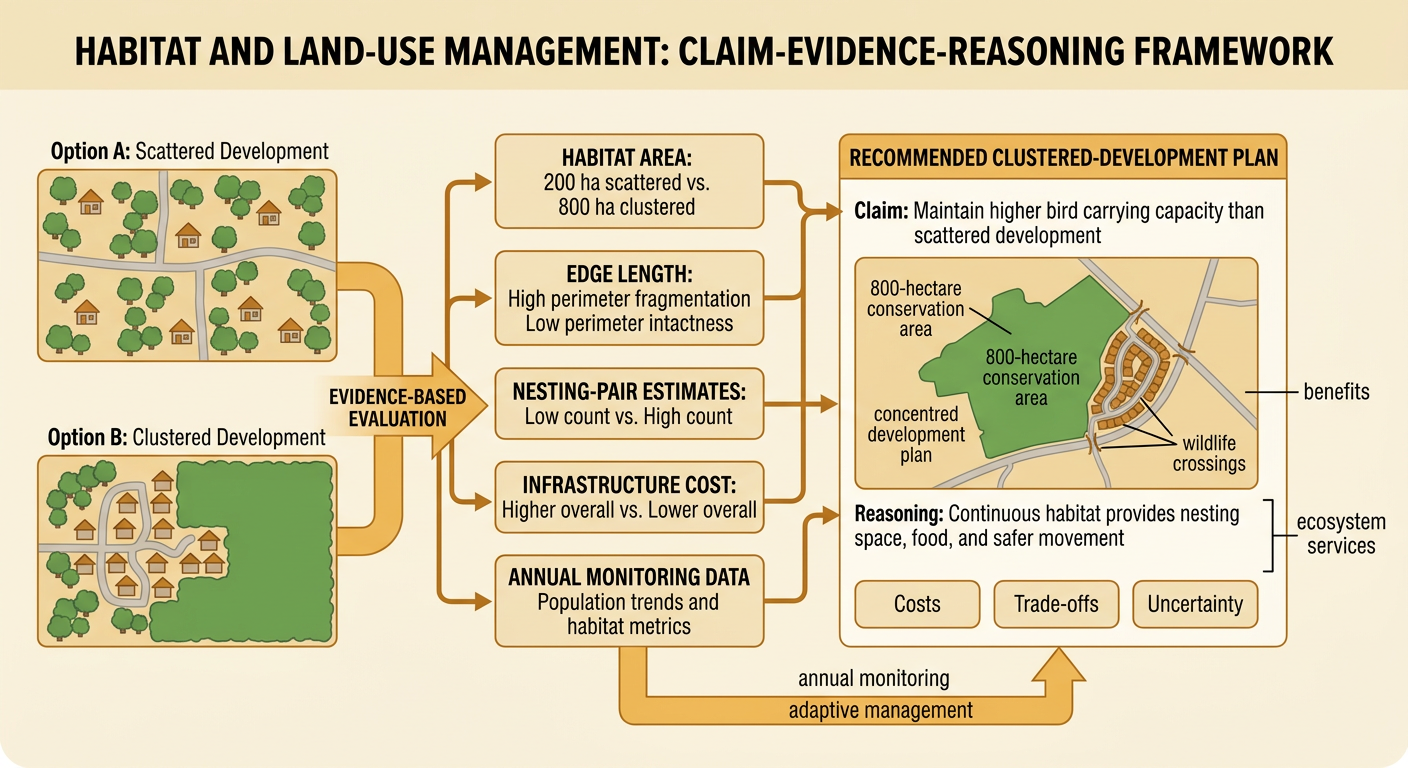
An ecosystem recommendation should connect a clear claim to quantitative evidence, ecological reasoning, and social considerations. For the grassland example, a planning team could recommend clustered development, an 800-hectare conservation area, and wildlife crossings at major roads. The claim is that this plan will maintain a higher bird carrying capacity than scattered development. Supporting evidence includes the larger protected area, fewer habitat edges, and population data linking nesting pairs to suitable habitat. The reasoning explains that continuous habitat provides nesting space, food, and safer movement. A complete recommendation also evaluates costs and trade-offs. Clustered construction may require zoning changes or higher infrastructure costs in one location, but it can reduce road length and preserve ecosystem services. The team should state uncertainties, monitor habitat and bird numbers annually, and revise the plan if measured outcomes differ from predictions.