
Cell Cycle Control: Mitosis and Cancer
Students model how mitosis supports growth and tissue repair, analyze how failed cell-cycle regulation can lead to cancer, and consider the outcomes of cancer-screening policies.

Illustrations are auto-generated and may be placeholders. They can be refreshed to match the narration.
Why Cells Divide
Multicellular organisms grow and maintain tissues by making new cells. Before a body cell divides, it copies its DNA so each daughter cell can receive a complete set of chromosomes. Cell division increases cell number rather than making individual cells endlessly larger. It also replaces cells that are worn out, damaged, or lost. For example, a small cut in the skin triggers nearby cells to divide. Some daughter cells fill the gap, while others differentiate, or become specialized, to rebuild layers of skin. Cell division and differentiation therefore work together to maintain a complex organism. Different tissues divide at different rates: cells lining the intestine divide often, while many mature nerve cells rarely divide. Signals from nearby cells and the environment help ensure that division occurs when and where it is needed.

Stages of the Cell Cycle
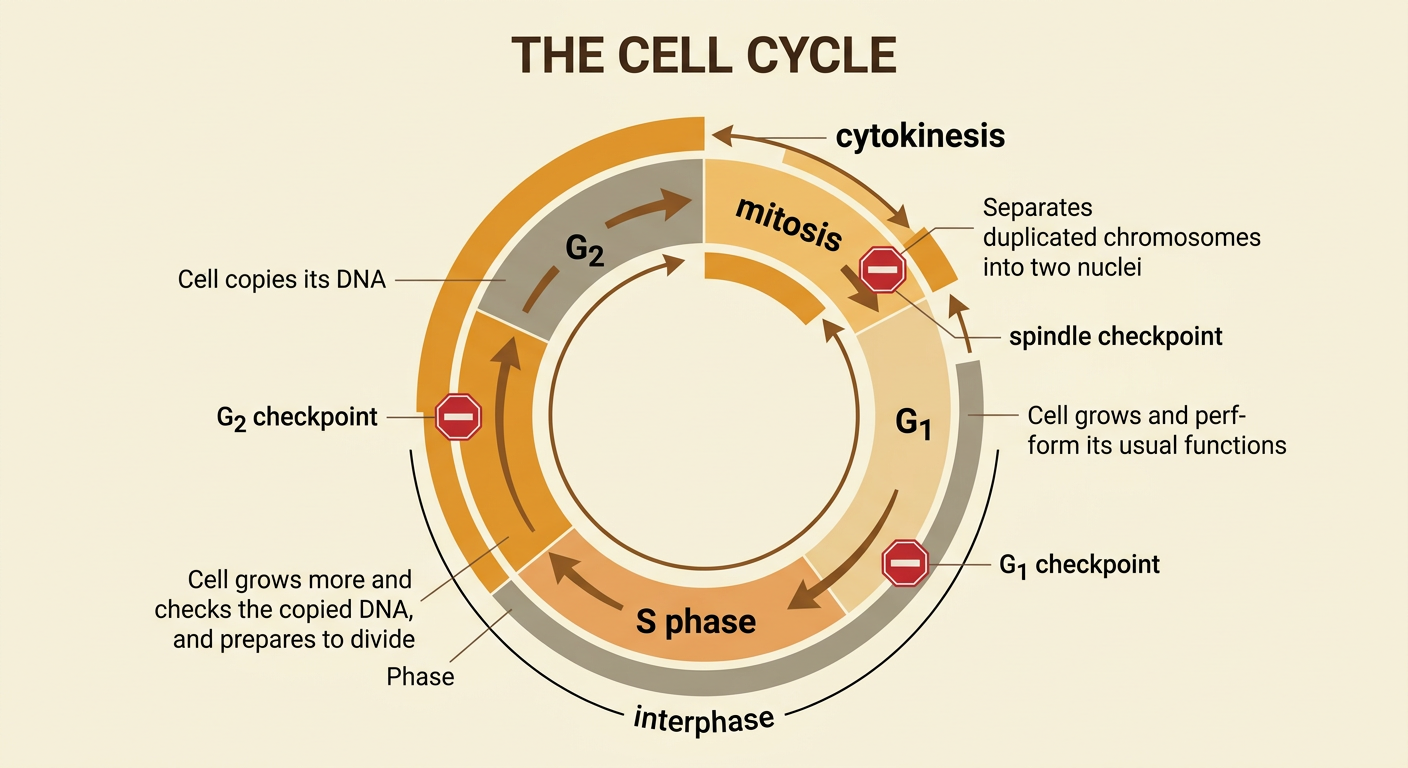
The cell cycle is an ordered sequence of growth, DNA replication, preparation, and division. During G1, a cell grows and performs its usual functions. During S phase, it copies its DNA. During G2, it grows further, checks the copied DNA, and prepares for division. Together, G1, S, and G2 make up interphase. Mitosis then separates the duplicated chromosomes into two nuclei, and cytokinesis divides the cytoplasm to form two daughter cells. Checkpoints help control movement through the cycle. For example, the G1 checkpoint may stop a skin cell with damaged DNA from entering S phase. Repair proteins can correct the damage, or the cell may undergo programmed cell death if repair is impossible. The cycle is circular because daughter cells may begin G1 and repeat the process.
Modeling Mitosis
A model of mitosis tracks duplicated chromosomes as they move into two new nuclei. In prophase, chromosomes condense, the spindle begins to form, and the nuclear envelope breaks down. In metaphase, duplicated chromosomes line up near the cell’s middle. Each duplicated chromosome consists of two sister chromatids joined at a centromere. In anaphase, sister chromatids separate and move toward opposite poles. In telophase, chromosomes arrive at the poles, new nuclear envelopes form, and chromosomes begin to loosen. Cytokinesis usually overlaps late mitosis and divides the cytoplasm. Students can model the process with paired paper strips as sister chromatids and strings as spindle fibers. The model should show one copy of each chromosome moving to each pole, explaining how one parent cell can produce two daughter cells with matching chromosome sets.

When Cell-Cycle Controls Fail
Normal cells respond to signals that promote, pause, or stop division. Regulatory proteins check DNA condition, cell size, chromosome attachment, and signals from surrounding tissue. Mutations can disrupt genes that control these proteins. A proto-oncogene normally encourages division only when appropriate, but a mutation can turn it into an oncogene that sends excessive growth signals. A damaged tumor-suppressor gene may fail to slow the cycle, repair DNA, or trigger cell death. As additional mutations accumulate, abnormal cells may divide repeatedly and form a tumor. For example, ultraviolet radiation can damage DNA in a skin cell. If checkpoint and repair systems fail, that cell’s descendants may continue growing. A malignant tumor can invade nearby tissue and spread to distant locations, a process called metastasis. Not every mutation causes cancer, and cancer usually develops through multiple changes over time.

Interpreting Cancer-Growth Data
Graphs help scientists compare cancer growth and treatment effects. Suppose a graph shows tumor-cell number over six weeks. An untreated sample rises from 1 million cells in week 0 to 32 million in week 5, doubling about once each week. A treated sample rises at first but levels near 4 million cells after week 2. The steep upward curve for the untreated sample indicates rapid exponential growth, while the flatter treated curve suggests that treatment slowed division or increased cell death. To translate the graph into words, identify the variables, units, overall trend, and important comparisons. Do not claim that the treatment cured the cancer unless the data show that the tumor disappeared and remained absent. Also consider limitations: a cell-culture result may not predict exactly what happens in a human body, and six weeks may be too short to measure long-term effects.

Evaluating Screening Policies
Cancer screening policies recommend tests for people who do not yet have symptoms. Their intended outcome is to detect certain cancers earlier, when treatment may be more effective. For example, a policy might recommend regular mammograms for people within a defined age range and risk group. Benefits can include fewer deaths and less intensive treatment after early detection. Unintended outcomes can include false-positive results, anxiety, extra procedures, cost, and overdiagnosis of cancers that might never have caused harm. False-negative results may also provide incorrect reassurance. To evaluate a policy, compare evidence about lives saved, harms, costs, access, and effects on different communities. Ask whether rural, low-income, or uninsured populations can obtain follow-up care. A strong policy uses reliable evidence, explains trade-offs clearly, protects informed choice, and is revised when better data become available.
