Cell Membranes: Maintaining Balance Through Osmosis
Students analyze a cell model and experimental evidence to explain how selectively permeable membranes regulate water movement and help cells maintain homeostasis.

Illustrations are auto-generated and may be placeholders. They can be refreshed to match the narration.
The Cell Membrane and Homeostasis
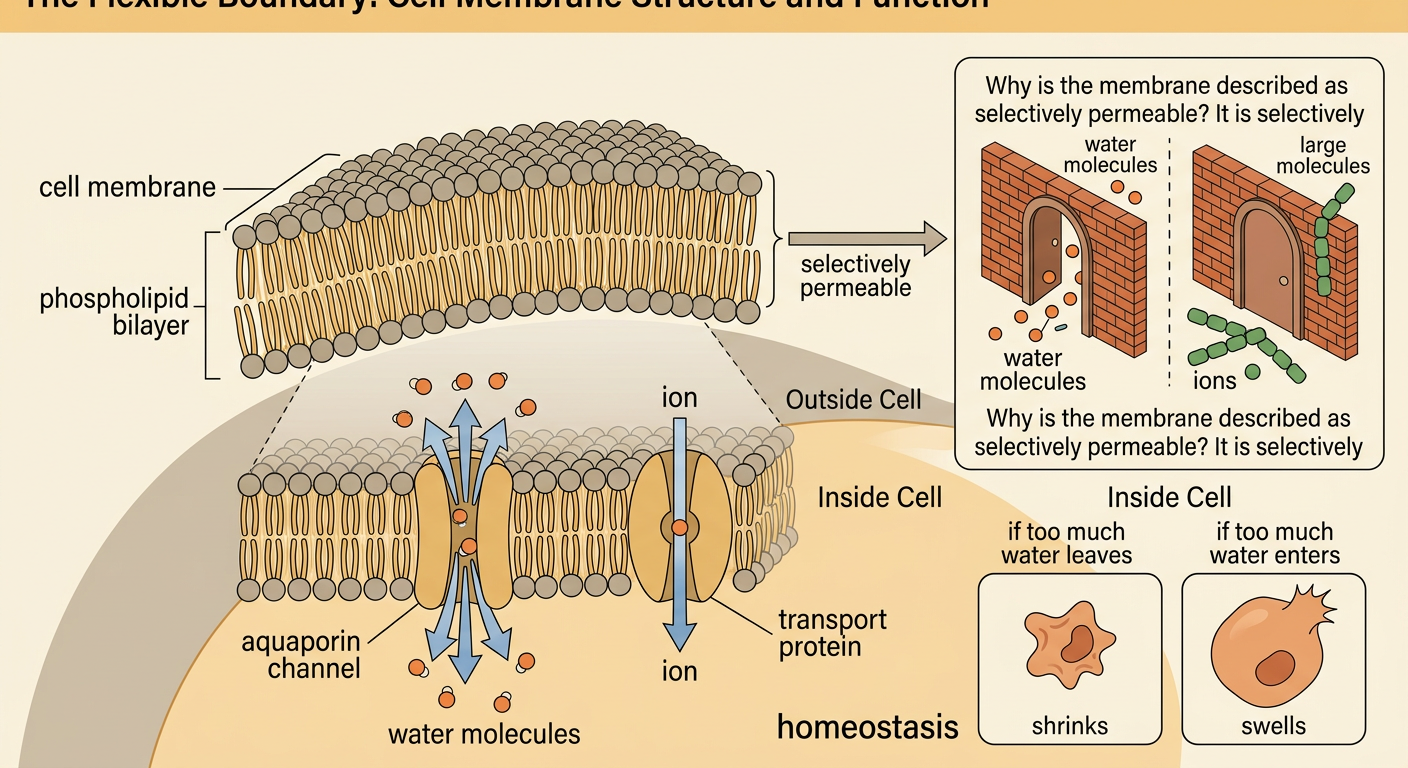
The cell membrane forms a flexible boundary between a cell and its environment. Its phospholipid bilayer allows some substances to cross more easily than others, so it is selectively permeable. Small molecules such as water can move across the membrane, often through channel proteins called aquaporins. Many ions and larger molecules require specific transport proteins. By controlling these movements, the membrane helps maintain homeostasis, or stable internal conditions. For example, a human cell must keep its water and ion levels within a limited range. If too much water enters, the cell may swell; if too much leaves, the cell may shrink. Membrane proteins, ion pumps, and chemical signals help cells adjust internal solute concentrations, which influences water movement and supports normal cell function.
Concentration Gradients
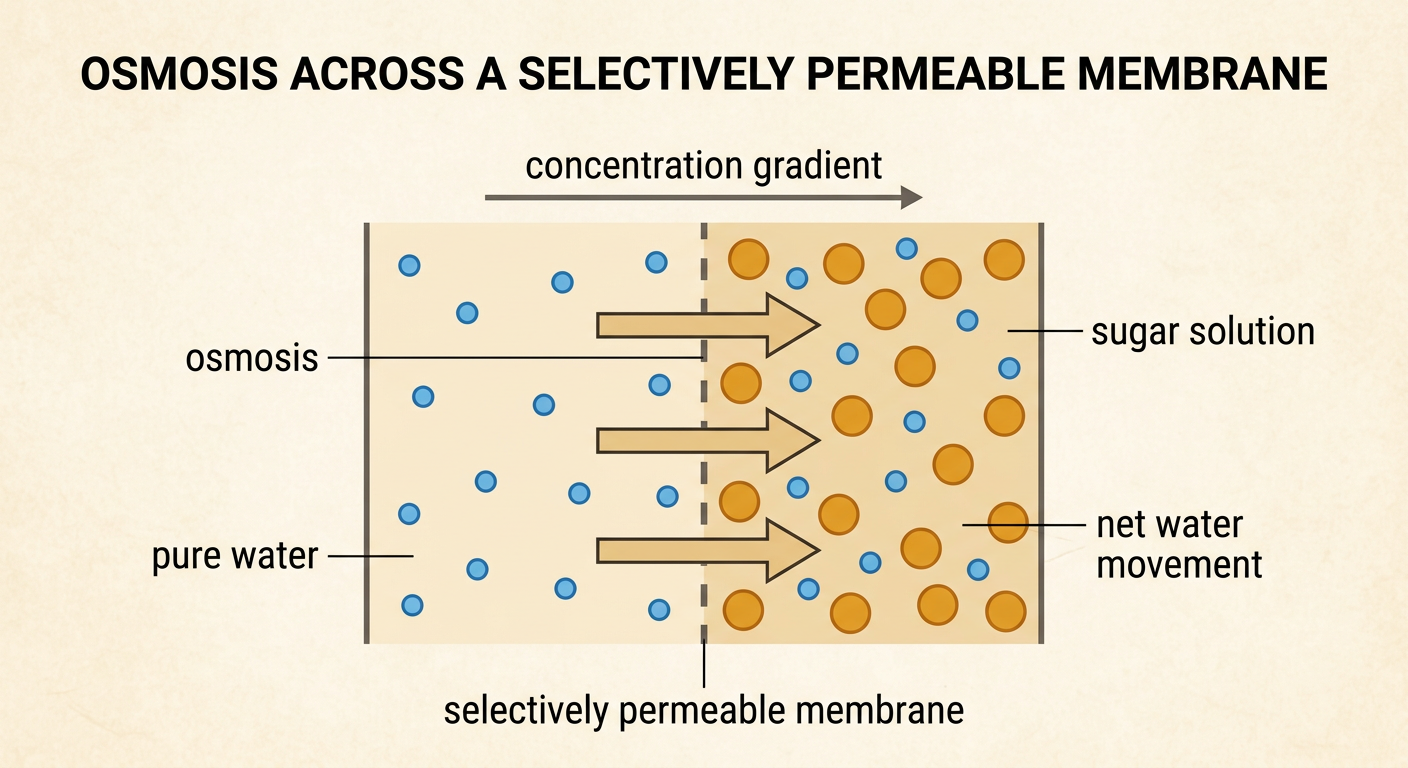
A concentration gradient is a difference in the amount of a substance between two regions. Particles tend to move by diffusion from an area of higher concentration to an area of lower concentration. During osmosis, the substance moving is water. A solution with more dissolved solute has a lower concentration of free water than a solution with less solute. Imagine a membrane separating pure water from a sugar solution. If water can cross but sugar cannot, water moves toward the sugar solution until the difference is reduced or opposing pressure prevents further net movement. Solutions can also be compared with a cell: an isotonic solution has a similar effective solute concentration, a hypertonic solution has a higher one, and a hypotonic solution has a lower one. These comparisons depend on solutes that cannot readily cross the membrane.
Predicting Water Movement
To predict osmosis, first identify the cell and the surrounding solution. Next, compare their concentrations of solutes that cannot cross the membrane. Finally, predict net water movement toward the side with the higher effective solute concentration. Suppose a cell containing 10 percent sucrose is placed in a 20 percent sucrose solution, and sucrose cannot cross the membrane. The outside solution is hypertonic, so water leaves the cell and its mass decreases. If the same cell is placed in a 5 percent sucrose solution, the outside is hypotonic, so water enters and its mass increases. In an isotonic solution, water still crosses in both directions, but there is no net movement. Predictions must consider membrane permeability because a solute that crosses easily may not produce a lasting osmotic gradient.

Osmosis Model Investigation
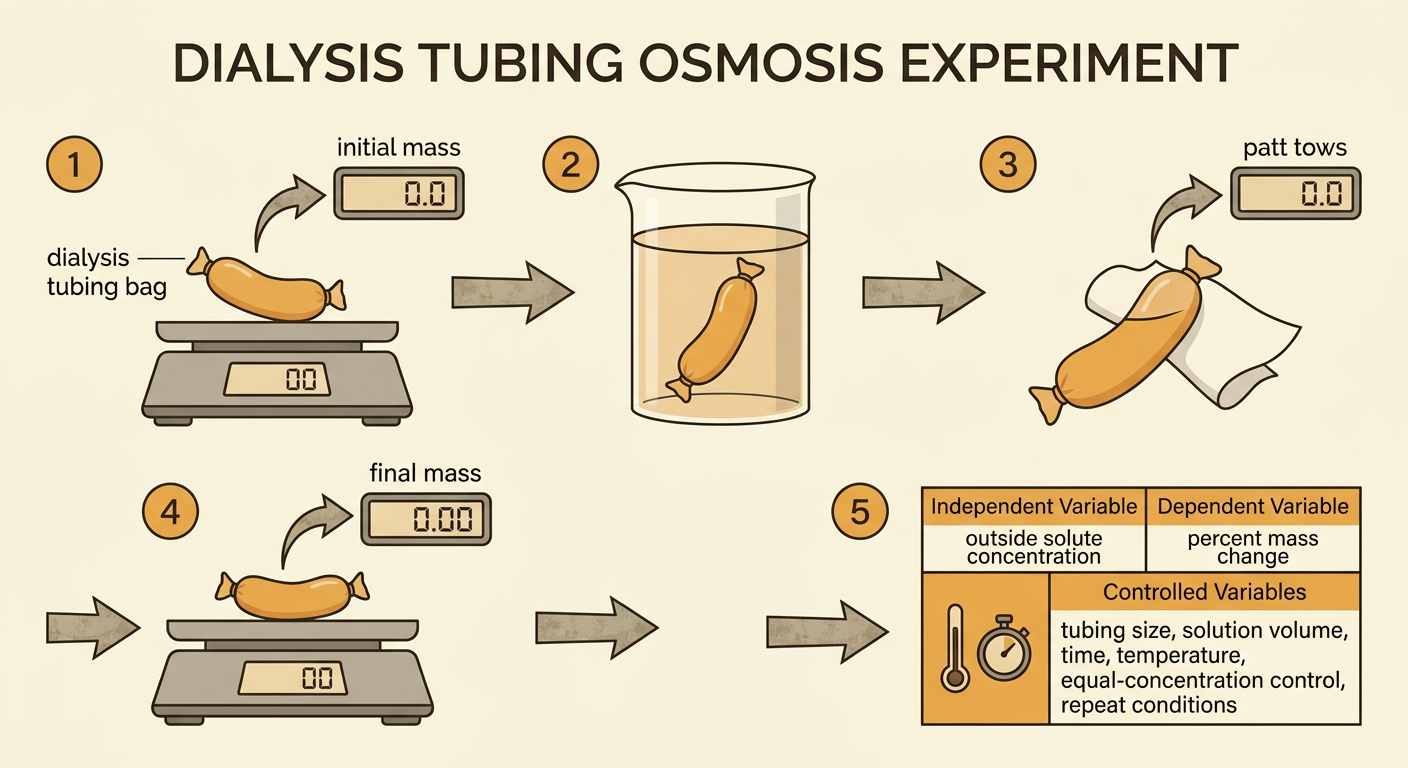
A dialysis tubing bag can model a cell because its pores allow water and some small particles to cross while blocking larger particles. Wear goggles, tie one end of soaked tubing, add a measured sucrose solution, remove excess air, and tie the other end. Rinse and dry the outside, then record the bag’s initial mass. Place it in a beaker containing a known solution for 30 minutes. Remove the bag, gently blot it in the same way each time, and record its final mass. Calculate percent mass change as final mass minus initial mass, divided by initial mass, times 100. Keep tubing size, solution volume, time, and temperature constant. Test several outside concentrations, include a control with equal concentrations, and repeat each condition. The independent variable is outside solute concentration; percent mass change is the dependent variable.
Analyzing Evidence
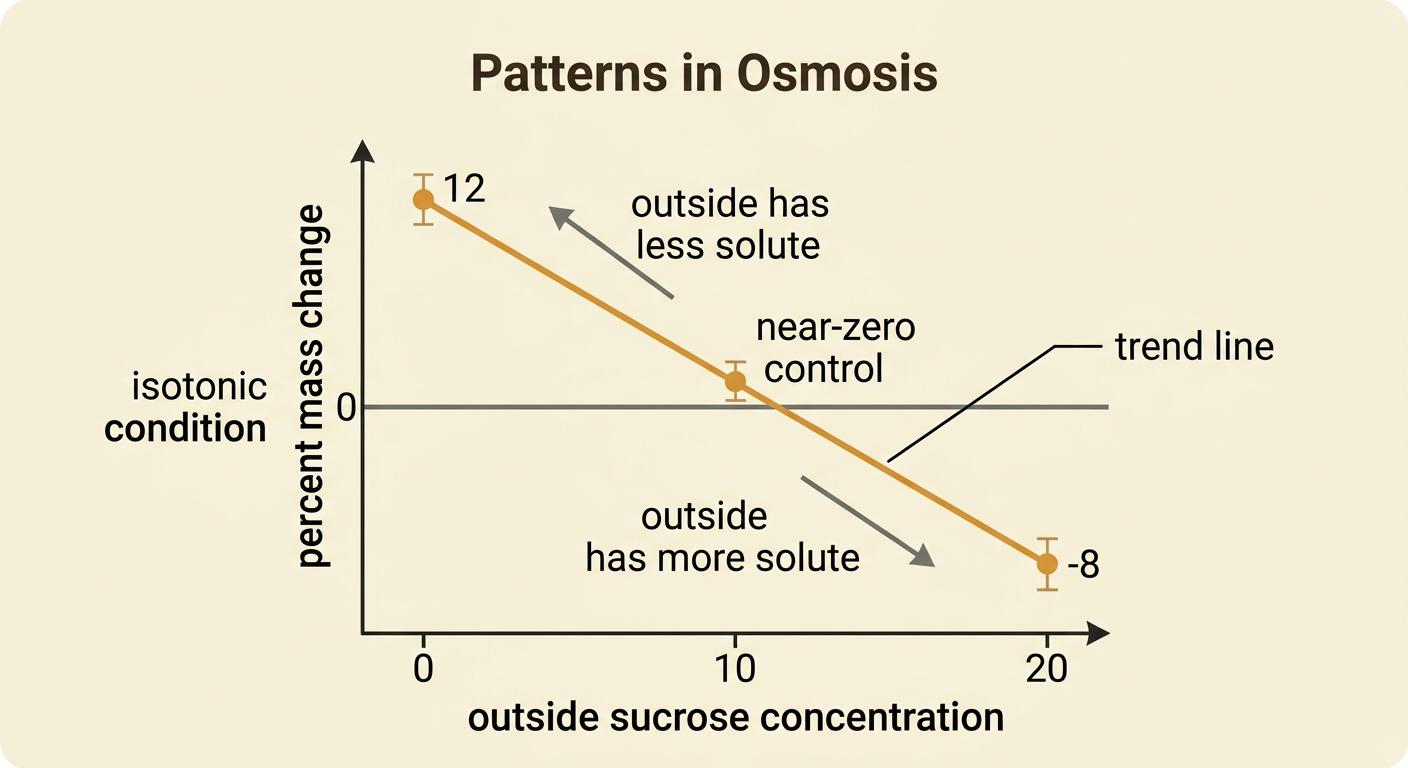
Evidence of osmosis comes from a pattern across measurements, not from one observation. Suppose bags containing 10 percent sucrose show average mass changes of plus 12 percent in distilled water, plus 1 percent in 10 percent sucrose, and minus 8 percent in 20 percent sucrose. The pattern supports the claim that water enters when the outside has less solute and leaves when the outside has more solute. Graph outside sucrose concentration on the horizontal axis and percent mass change on the vertical axis. The concentration where the trend crosses zero estimates an isotonic condition. A counterclaim might state that handling caused the mass changes. Repeated trials and a near-zero control weaken that counterclaim, but they do not eliminate it. Uneven blotting, leaking knots, concentration errors, and differences in tubing surface area remain weaknesses that should be reported.
Explaining Cell Responses
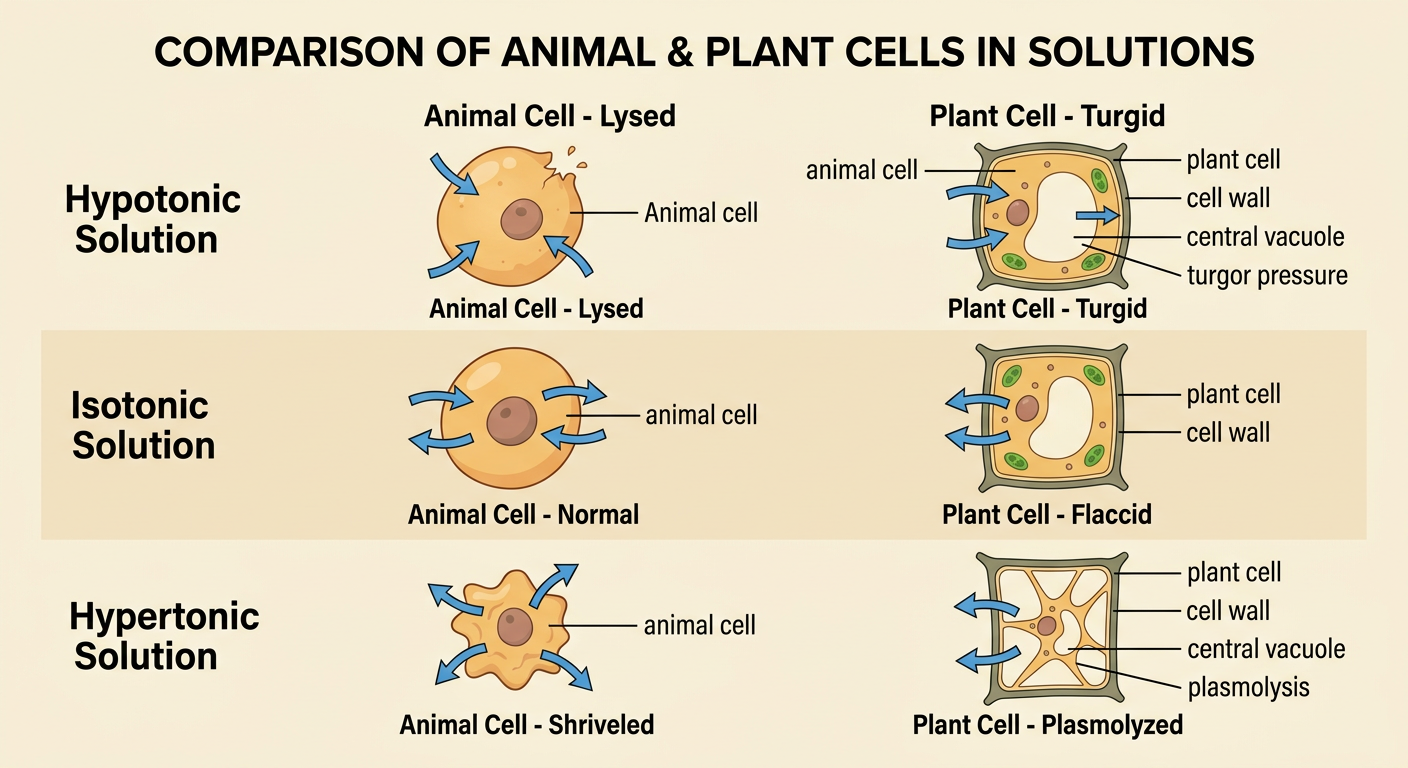
An evidence-based explanation connects solution conditions, water movement, and cell response. In a hypertonic solution, an animal cell loses water and shrinks because net water movement is outward. In a hypotonic solution, it gains water and may burst because it lacks a rigid cell wall. Plant cells respond differently: water entering the central vacuole produces turgor pressure against the cell wall, helping the plant remain firm. When a plant cell loses water, its membrane can pull away from the wall, a response called plasmolysis. Cells maintain homeostasis by adjusting ions and other solutes through channels, pumps, and signaling pathways, which changes osmotic conditions and water movement. For example, kidney cells respond to hormonal signals by changing the number of aquaporins in their membranes, helping the body conserve or release water. These responses regulate, rather than completely stop, normal molecular movement.