Chemical Water Quality: Detecting and Reducing Contaminants
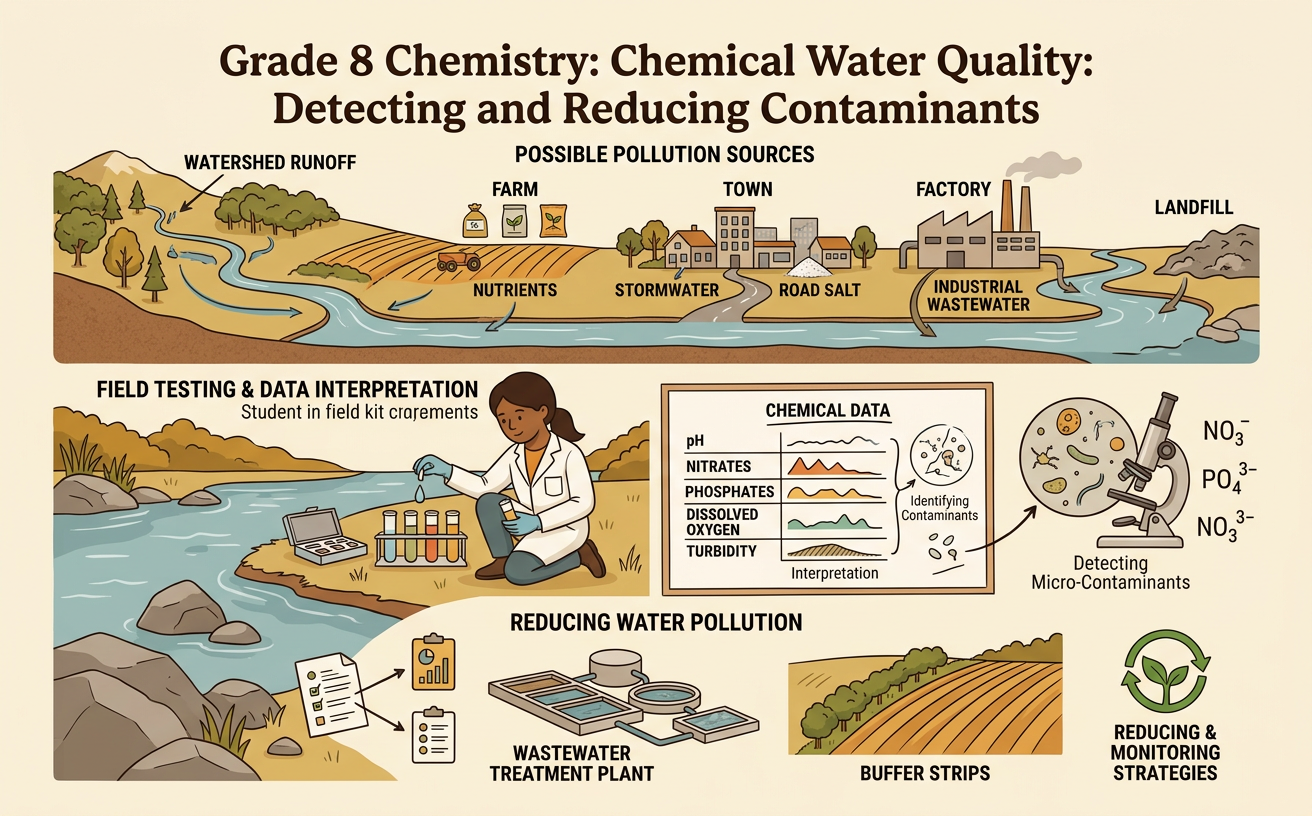
Students interpret chemical water-quality data, identify possible contaminant sources, and evaluate strategies for monitoring and reducing water pollution.
Illustrations are auto-generated and may be placeholders. They can be refreshed to match the narration.
What Makes Water Chemically Safe?
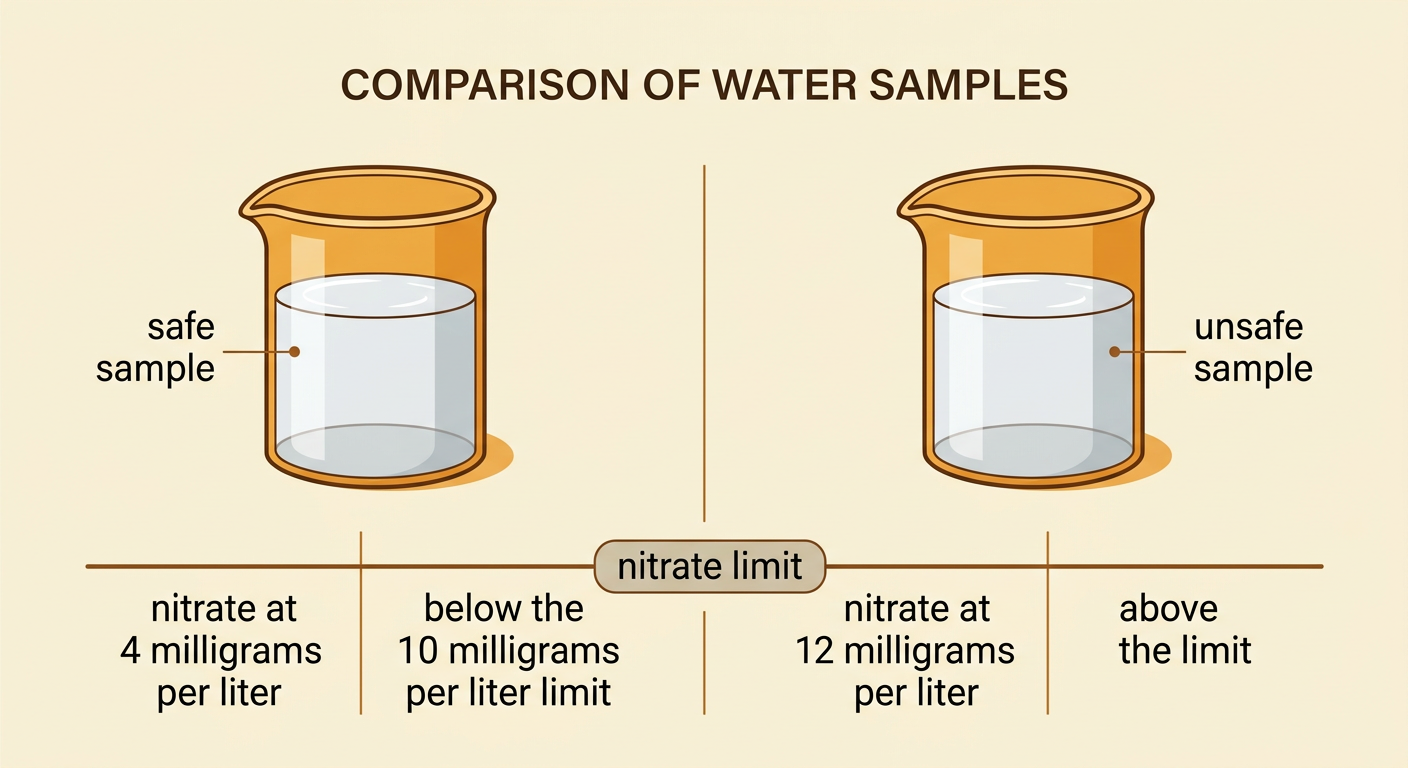
Chemically safe water contains substances at concentrations that are acceptable for its intended use. Drinking water standards are usually stricter than standards for irrigation or recreation. Scientists test properties such as pH and the concentrations of nutrients, metals, salts, and other chemicals. They compare results with health-based limits. Clear water is not automatically safe because many dissolved contaminants cannot be seen, smelled, or tasted. Concentration describes how much of a substance is present in a certain amount of water. For example, the U.S. drinking water limit for nitrate measured as nitrogen is 10 milligrams per liter. A sample containing 4 milligrams per liter is below that limit, while a sample containing 12 milligrams per liter exceeds it. One measurement does not describe every possible contaminant, so several tests are needed.
Common Water Contaminants and Their Sources
Water contaminants enter rivers, lakes, and groundwater from both specific and widespread sources. A leaking industrial pipe is a point source because pollution enters at one identifiable location. Runoff from many lawns or farm fields is a nonpoint source because it spreads across a large area. Fertilizers and animal waste can add nitrates and phosphates. These nutrients may cause excessive algae growth, which can reduce dissolved oxygen when the algae die and decompose. Road salt raises chloride levels, while mines and industrial sites may release metals. Old plumbing can add lead to drinking water through corrosion. For example, after heavy rain, fertilizer can wash from a cornfield into a stream. A nitrate increase downstream does not prove the field is the only source, but land-use information and repeated tests can support that explanation.

Reading Concentration and Water-Quality Data
A water-quality table usually lists the sampling location, date, chemical, concentration, and unit. Concentrations are often reported in milligrams per liter, abbreviated mg/L, or micrograms per liter, abbreviated µg/L. One milligram equals 1,000 micrograms, so units must match before values are compared. In water, 1 mg/L is approximately 1 part per million for many dilute substances. Suppose three nitrate samples from a creek measure 2, 5, and 11 mg/L. The values increase from upstream to downstream, and the last value is above the 10 mg/L drinking water limit for nitrate measured as nitrogen. However, a creek is not automatically a drinking water supply, so students should identify which standard is being used and why. They should also check whether measurements were repeated and whether the same testing method was used.

Identifying Patterns in Contamination
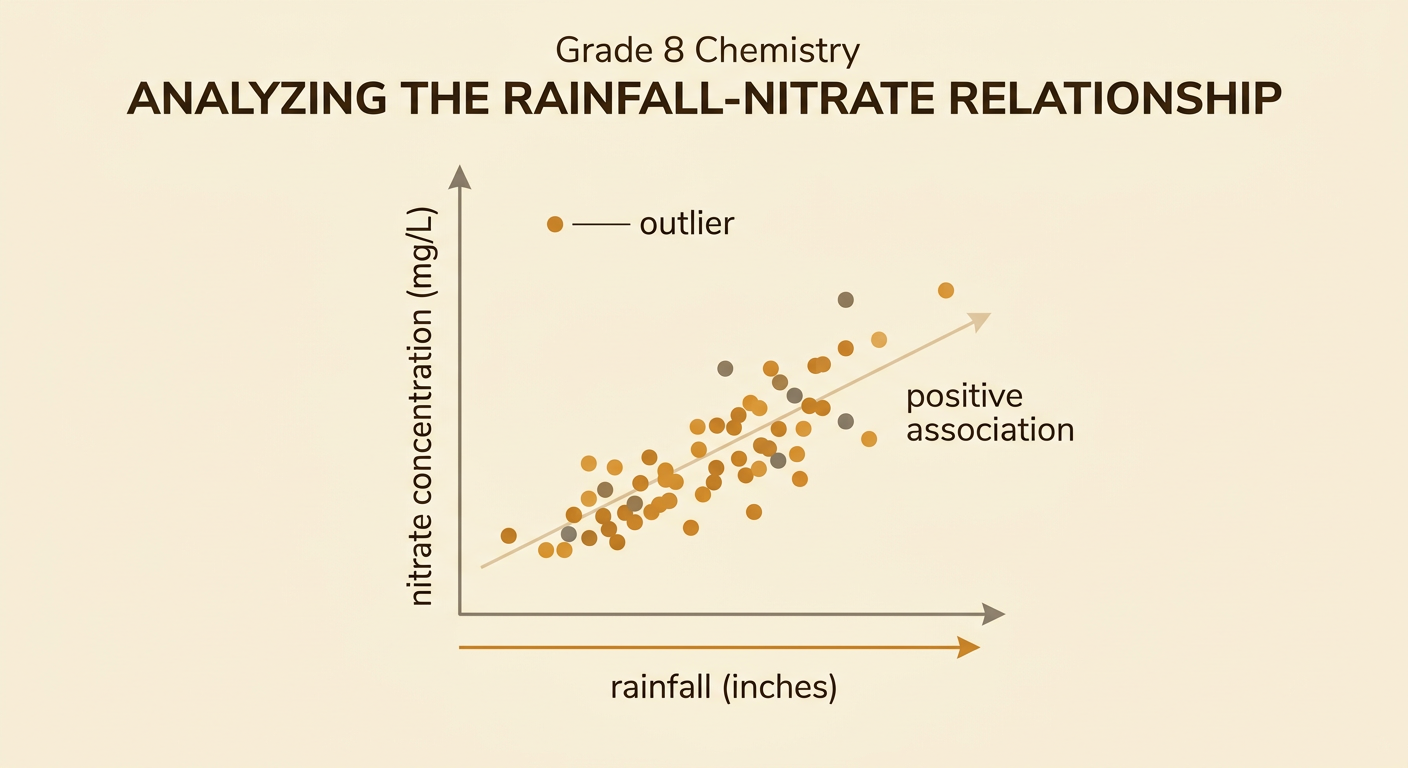
A scatter plot can reveal a relationship between two measured variables. The horizontal axis shows the explanatory variable, and the vertical axis shows the response variable. Each point represents one paired observation. For example, students might plot weekly rainfall on the horizontal axis and nitrate concentration in a stream on the vertical axis. If points generally rise from left to right, the variables have a positive association: weeks with more rain tend to have higher nitrate levels. This pattern could support the idea that runoff carries fertilizer into the stream. Outliers may identify unusual spills, testing errors, or other conditions worth investigating. A trend does not prove cause and effect. Land use, season, and sampling location could also influence nitrate. Scientists strengthen conclusions by collecting many measurements, comparing sites, and combining the graph with maps and written records.
Monitoring and Treatment Strategies
An effective monitoring plan states what will be tested, where samples will be collected, how often testing will occur, and what action follows an unsafe result. To study farm runoff, students could test nitrate upstream and downstream from fields before and after rainfall. Using the same collection and testing procedures makes results more comparable. Monitoring identifies a problem, while prevention and treatment reduce it. Vegetated buffer strips can absorb nutrients and slow soil runoff before it reaches a stream. Farmers can also apply only the amount of fertilizer crops need. Water-treatment methods depend on the contaminant. Activated carbon can remove many organic chemicals but does not effectively remove all dissolved salts or nitrate. Ion exchange or reverse osmosis can reduce nitrate in drinking water. A strong plan combines source reduction, repeated measurement, and a treatment selected for the chemical involved.

Evaluating Water-Protection Policies
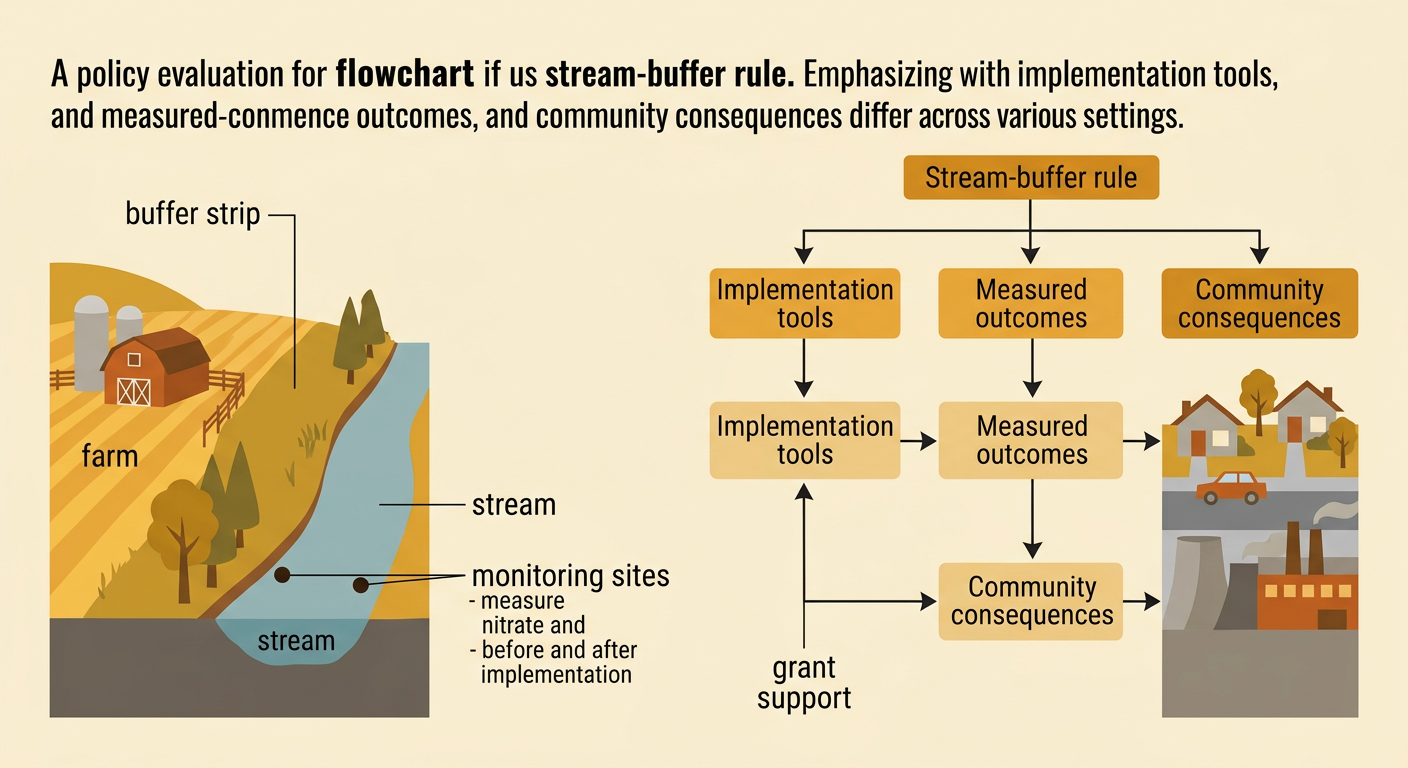
Public policies establish shared rules for protecting water when individual actions may affect an entire community. To evaluate a policy, consider its purpose, implementation, evidence of effectiveness, cost, fairness, and unintended consequences. For example, a county policy might require vegetated buffer strips beside streams. Its purpose is to reduce fertilizer and sediment runoff. Implementation could include maps, minimum buffer widths, inspections, technical support, and penalties for repeated violations. Monitoring nitrate and turbidity before and after the policy can show whether water quality improves. The policy may protect drinking-water sources and aquatic habitats, but it may also reduce the land available for crops or create costs for farmers. Grants could make compliance more practical and fair. The same policy may work differently in rural farming areas, suburban neighborhoods, and industrial districts, so students should compare results across settings and propose revisions based on evidence.