
Choosing an Energy Future: Comparing Solar, Wind, and Fossil Fuels
Students analyze energy-output, environmental-impact, and cost data to evaluate competing electricity-generation options and recommend an evidence-based energy plan for a community.
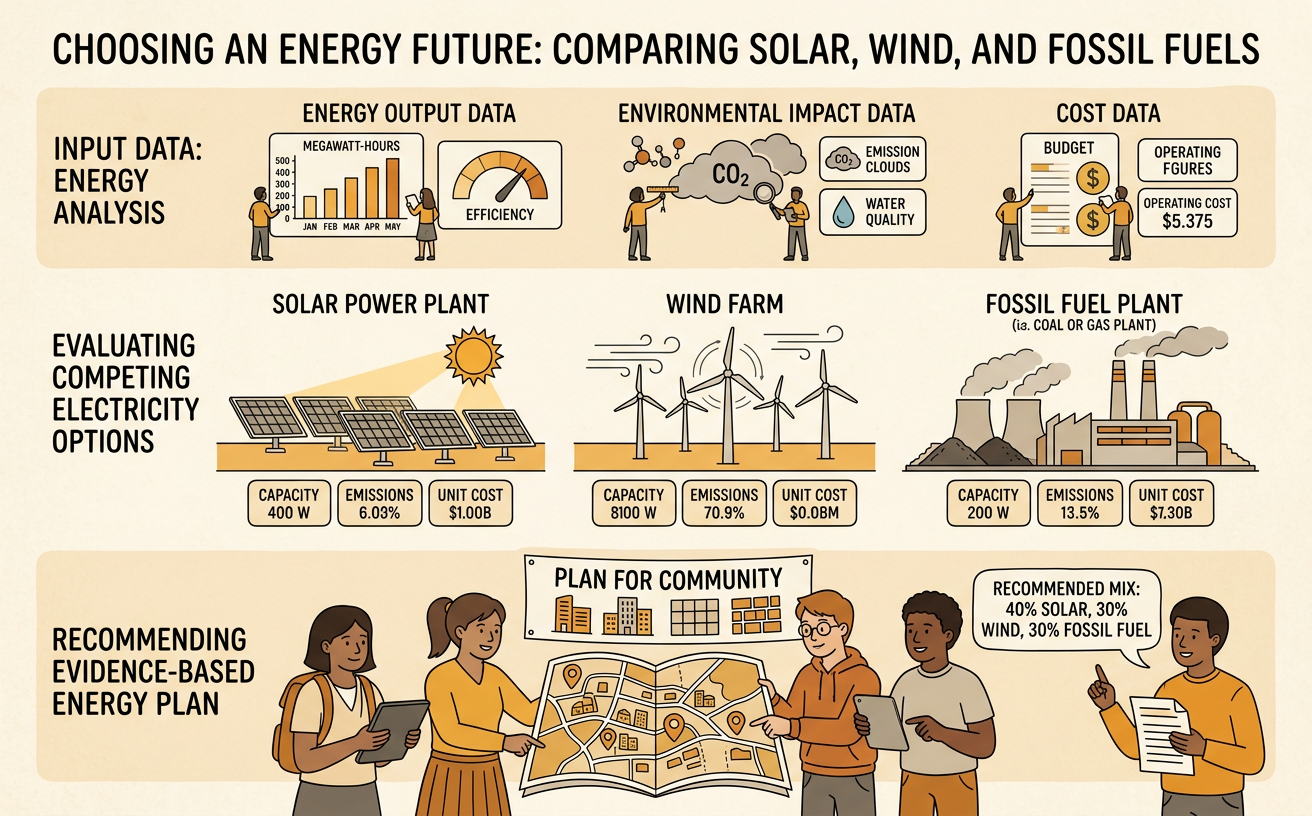
Illustrations are auto-generated and may be placeholders. They can be refreshed to match the narration.
Community Energy Challenge
A community energy plan must provide enough electricity while balancing reliability, affordability, environmental effects, and public priorities. Begin by defining the problem and measurable constraints rather than choosing a favorite technology. For example, imagine a town that uses 100,000 megawatt-hours of electricity each year and expects demand to increase by 10 percent within a decade. The town also wants to limit electricity costs, reduce greenhouse gas emissions, and maintain power during periods of high demand. Students can evaluate possible plans using common criteria such as annual energy output, cost per megawatt-hour, emissions, land use, and reliability. Some criteria may conflict: the least expensive option may produce more pollution, while a low-emission option may require storage or backup generation. A strong decision identifies these tradeoffs and explains which community goals receive the greatest weight.

Comparing Energy Resources
Solar, wind, and fossil-fuel power plants convert different energy sources into electricity. Solar panels generate electricity when sunlight reaches them, while wind turbines use moving air to turn generators. Fossil-fuel plants burn coal, oil, or natural gas to release stored chemical energy, usually producing electricity on demand. Nameplate capacity describes a plant’s maximum power, but annual output depends on how often it operates. For example, a 100-megawatt solar facility with a 25 percent capacity factor would generate about 219,000 megawatt-hours per year. At the same size, a wind facility operating at 40 percent would generate about 350,400 megawatt-hours. A natural gas plant operating at 60 percent would generate about 525,600 megawatt-hours. These illustrative values show why equal-capacity facilities do not necessarily produce equal amounts of annual electricity.

Interpreting Cost and Output Data
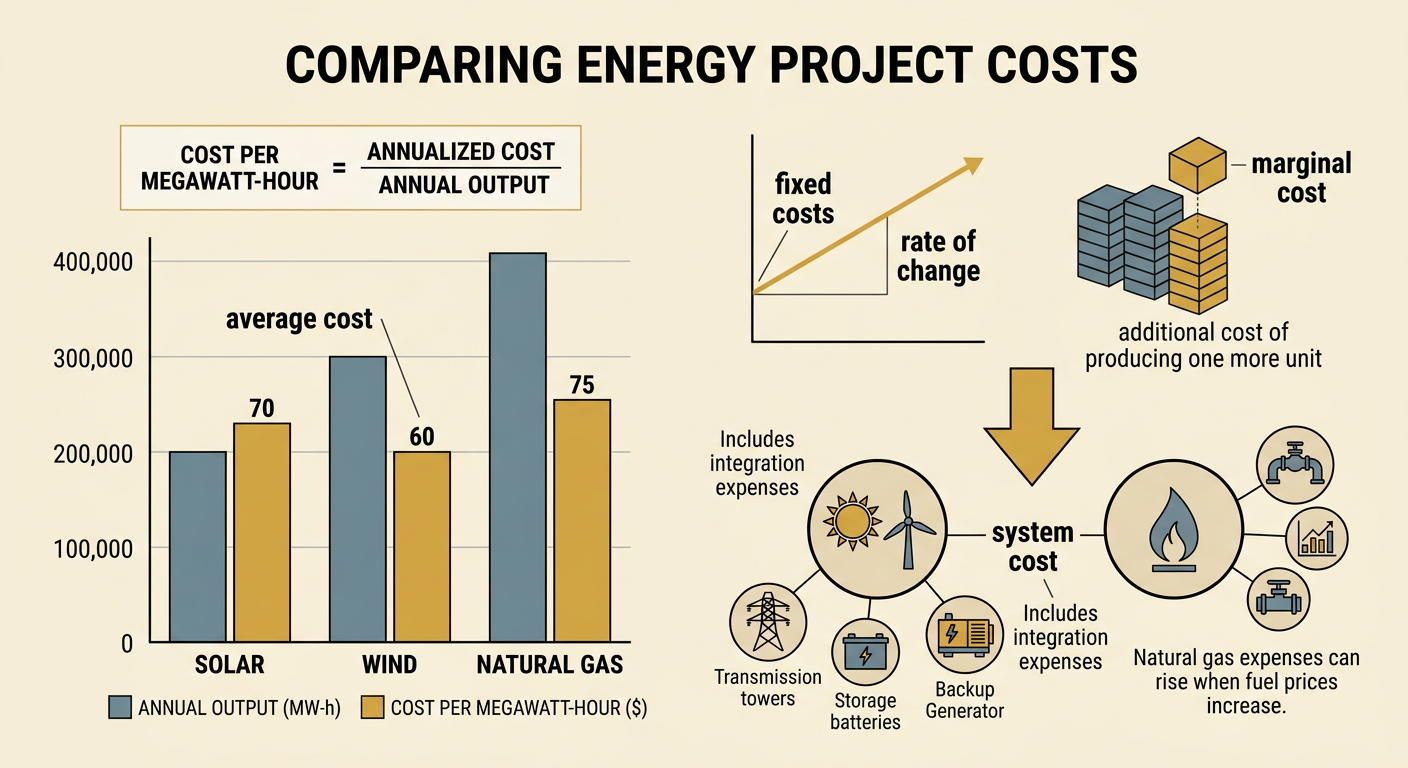
Cost and output data can be compared by calculating cost per unit of electricity. Suppose annualized costs are $14 million for a solar project producing 200,000 megawatt-hours, $18 million for a wind project producing 300,000 megawatt-hours, and $30 million for a natural gas project producing 400,000 megawatt-hours. Dividing cost by output gives $70 per megawatt-hour for solar, $60 for wind, and $75 for natural gas. A graph of output and total cost can also reveal fixed costs, rate of change, and whether costs rise steadily. However, an average cost does not include every system expense. Solar and wind may require transmission, storage, or backup power, while fossil-fuel costs can change with fuel prices. Marginal cost is the additional cost of generating one more unit of electricity, so it is especially useful when deciding which source should meet the next increase in demand.
Weighing Environmental Tradeoffs
Every energy source has environmental effects, but the type and scale of those effects differ. Fossil-fuel plants emit carbon dioxide and air pollutants during operation and can affect water and nearby communities. Solar and wind produce little pollution while operating, although manufacturing, construction, land use, mining, and disposal create life-cycle impacts. Wildlife effects also matter: poorly located wind turbines can harm birds or bats, and large solar facilities can disturb habitat. Consider illustrative life-cycle emission rates of 40 kilograms of carbon dioxide equivalent per megawatt-hour for solar, 12 for wind, and 450 for natural gas. Producing 100,000 megawatt-hours would then result in about 4,000 metric tons for solar, 1,200 for wind, and 45,000 for natural gas. Environmental comparisons should also consider location and mitigation, such as placing projects on previously developed land or adjusting turbine operation during migration periods.

Building an Evidence-Based Recommendation
An evidence-based recommendation states a clear claim, supports it with relevant data, and addresses disadvantages and uncertainty. A community might recommend obtaining 50 percent of its electricity from wind, 30 percent from solar, and 20 percent from natural gas while investing in storage, transmission, and energy efficiency. For annual demand of 100,000 megawatt-hours, those shares equal 50,000, 30,000, and 20,000 megawatt-hours. The plan could argue that wind and solar reduce emissions, while limited natural gas generation supports reliability when renewable output is low. It should also acknowledge fuel-price risk and natural gas emissions. Marginal analysis can test the next decision: replacing 10,000 megawatt-hours of natural gas with wind would avoid about 4,380 metric tons of carbon dioxide equivalent using the sample emission rates. A final recommendation should explain assumptions, compare benefits with costs, and identify conditions that could change the conclusion.
