
Cleaning and Querying Public Data with SQL
Students clean a small public dataset, design a structured table, and use SQL queries to answer a clearly defined civic or scientific question.

Illustrations are auto-generated and may be placeholders. They can be refreshed to match the narration.
Define the Data Question
Begin with a question that is specific, measurable, and answerable with available data. For example: “During July 2023, which air-monitoring station in Allegheny County, Pennsylvania, recorded the greatest number of days with average PM2.5 above 35.4 micrograms per cubic meter?” This question identifies a place, time period, measurement, threshold, and comparison. Gather an EPA Air Quality System daily-data file, station metadata, and the agency’s data dictionary. Check each source’s date, publisher, geographic coverage, units, and collection method. A local health department page may provide useful context, but it should not replace the measurement source. Record why each source was selected. Defining the question before cleaning prevents collecting unnecessary fields or changing the goal to match convenient results.

Inspect Fields and Data Types
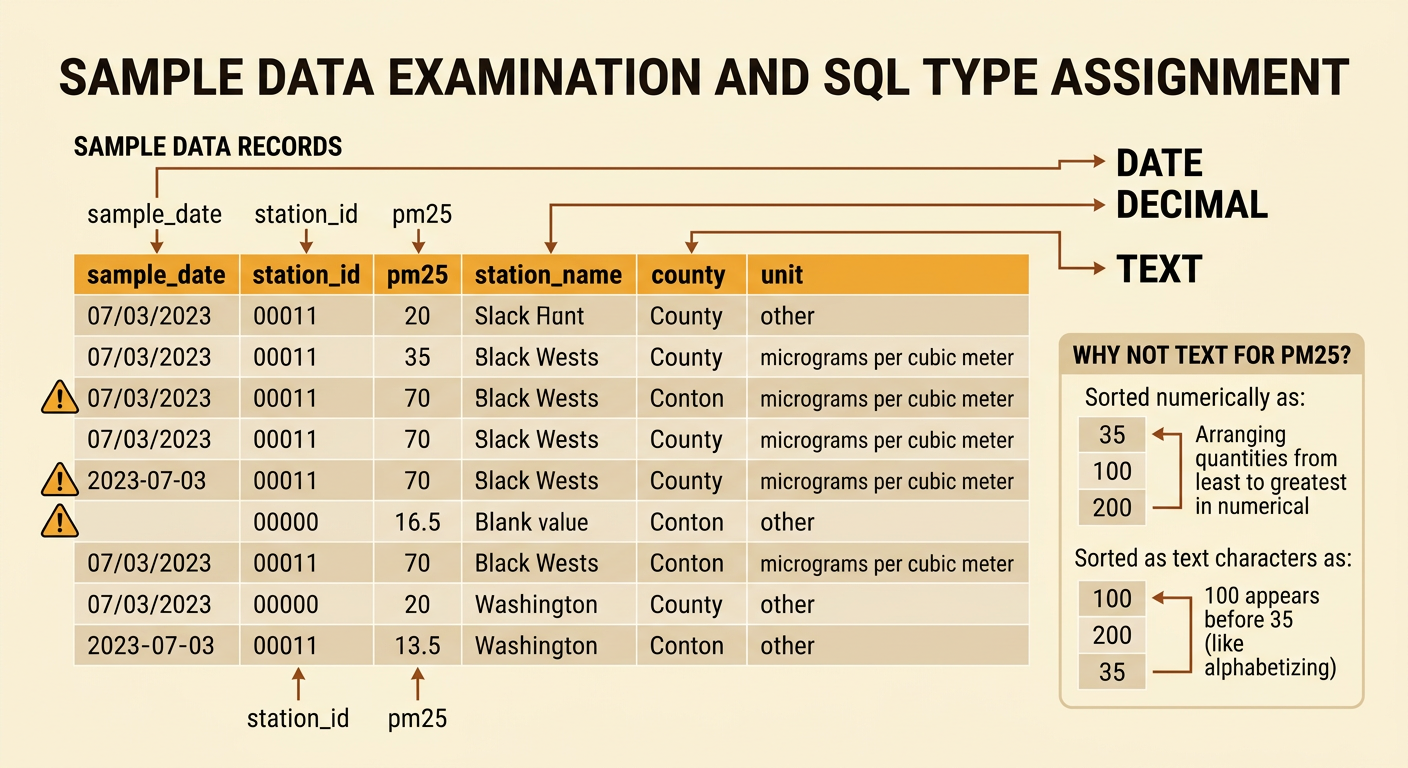
Open a small sample before importing the entire file. Read the field names, several records, and the data dictionary together. For this investigation, useful fields might include sample_date, station_id, station_name, county, pm25, and unit. Assign sample_date the DATE type and pm25 a numeric type such as DECIMAL. Store station_id as TEXT because an identifier can contain letters or leading zeros and is not used for arithmetic. County and station_name are also text. Look for suspicious values, mixed date formats, duplicate station-day records, and units other than micrograms per cubic meter. For example, “07/03/2023,” “2023-07-03,” and a blank date require attention. Data types matter because text-based numbers can sort incorrectly: “100” may appear before “35” when treated as text.
Clean Missing and Inconsistent Values
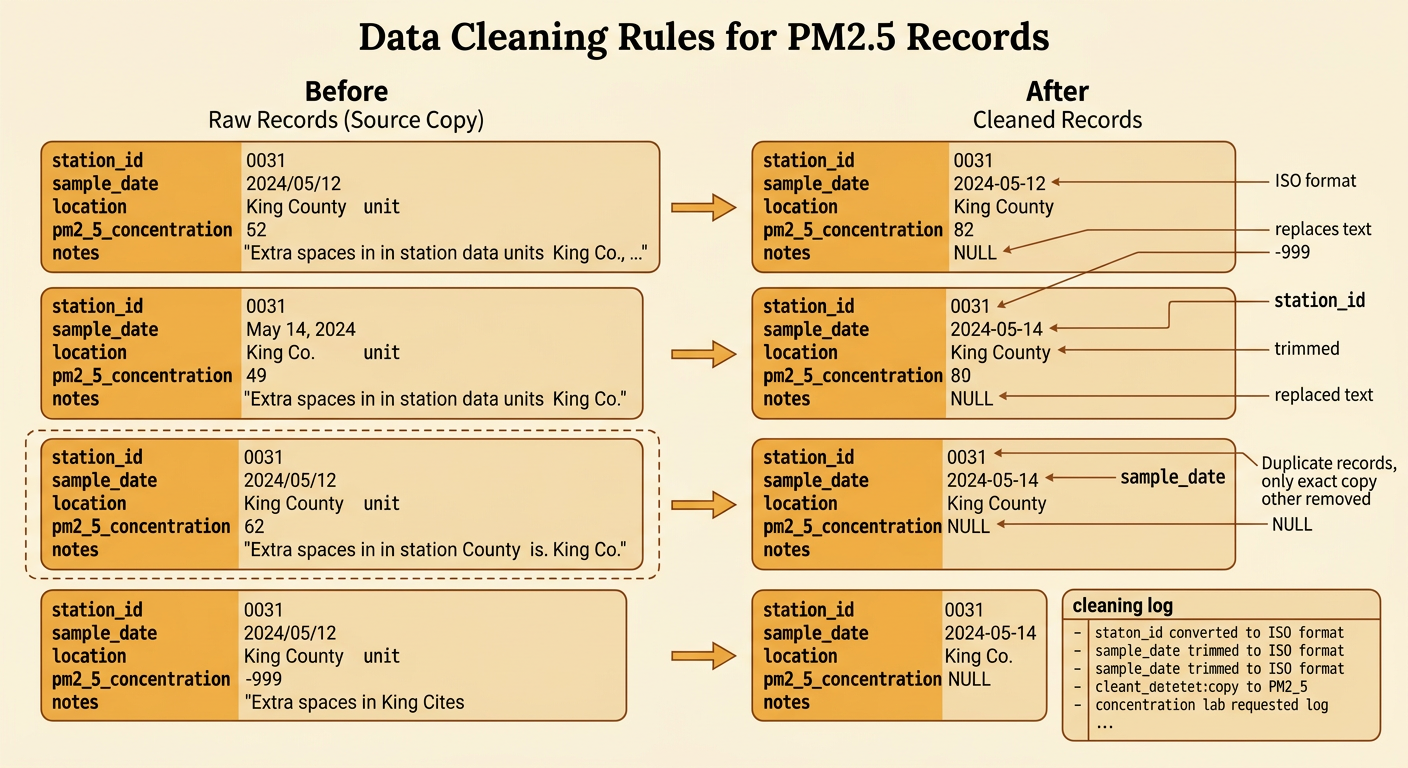
Create cleaning rules before changing any record, and preserve an untouched copy of the source file. Convert valid dates to ISO format, YYYY-MM-DD. Standardize county names and units only when the source documentation confirms that the values mean the same thing. Replace documented missing-value codes, such as -999, with SQL NULL rather than zero; zero is a real measurement, while NULL means unknown or unavailable. Trim extra spaces, but keep station identifiers as text so leading zeros remain. Check duplicates using station_id and sample_date. If two rows are exact copies, keep one. If their PM2.5 values differ, consult timestamps or source notes instead of averaging them automatically. Maintain a cleaning log. For example, record: “Row 18: pm25 -999 changed to NULL because the data dictionary defines -999 as missing.”
Organize a Relational Table
Design one row to represent one observation: the daily PM2.5 value from one station on one date. A table named air_quality can contain sample_date DATE NOT NULL, station_id TEXT NOT NULL, station_name TEXT, county TEXT, pm25 DECIMAL, and unit TEXT. Use the combination of sample_date and station_id as a composite primary key because that pair should identify one daily station record. This constraint blocks accidental duplicates. Add a CHECK rule requiring pm25 to be NULL or nonnegative, because negative concentrations are invalid after missing codes have been removed. A second CHECK rule can limit unit to “µg/m³” if every imported value has been confirmed in that unit. For example, station 0031 on 2023-07-03 occupies one row, and its measurement remains connected to the correct station and date.

Write and Test SQL Queries
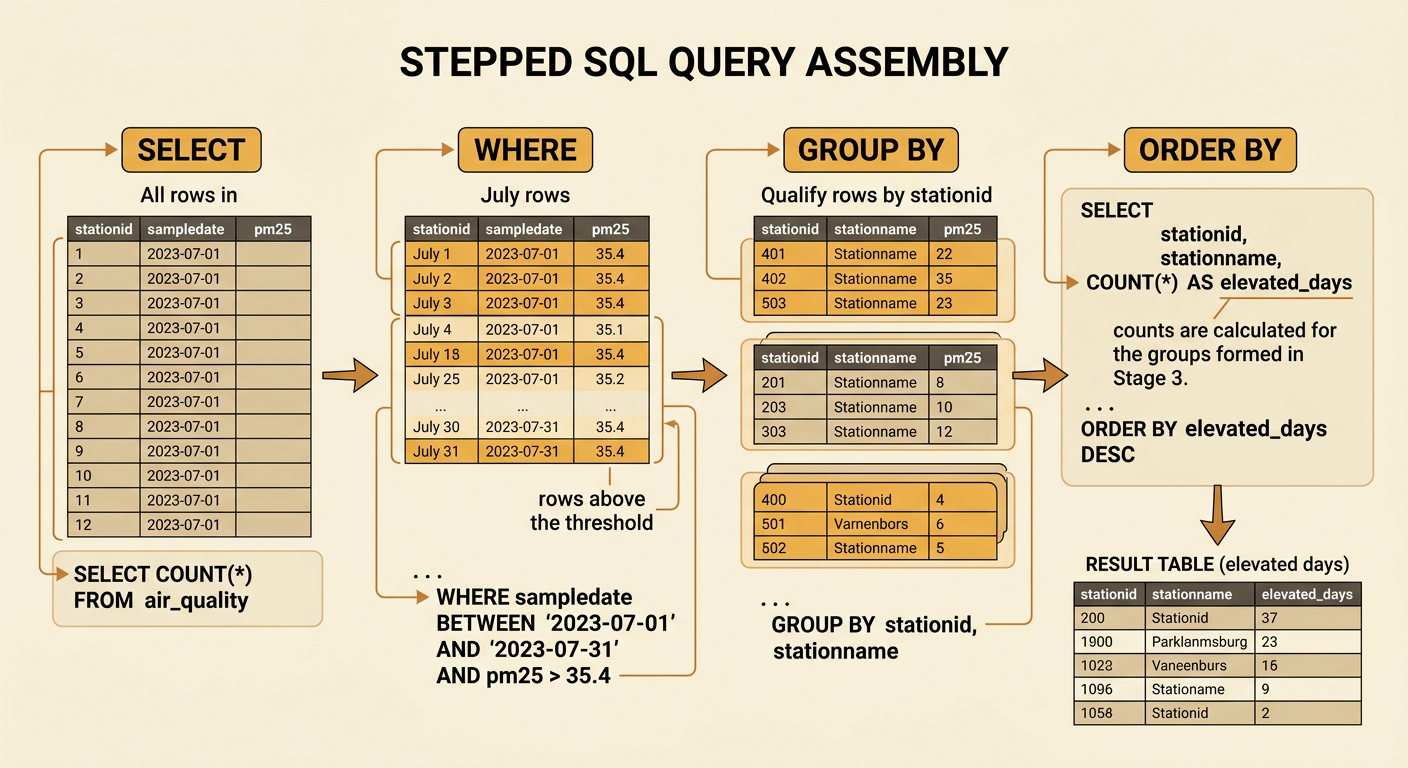
Build the query in small, testable steps. First count all rows, then filter the date range, then add the PM2.5 condition, and finally group and sort. The main query is: SELECT station_id, station_name, COUNT(*) AS elevated_days FROM air_quality WHERE sample_date BETWEEN '2023-07-01' AND '2023-07-31' AND pm25 > 35.4 GROUP BY station_id, station_name ORDER BY elevated_days DESC; Because comparisons with NULL are not true, missing PM2.5 values are automatically excluded. Test each clause separately. A date-check query should return no June or August records. A threshold-check query should return only values greater than 35.4, not values equal to it. For a tiny practice subset, manually count elevated days for one station and compare that count with SQL. If the values disagree, inspect duplicates, types, boundaries, and cleaning rules before continuing.
Verify and Interpret Results
A query result is evidence only after it has been checked. Compare the leading station’s count with a manual count from the cleaned table. Run a second query that lists its qualifying dates and PM2.5 values, then confirm that the number of listed rows matches elevated_days. Check that every station had enough reporting days; a station with many missing records may not be fairly comparable. Compare the result with a spreadsheet pivot table or simple chart, and revisit the EPA metadata for monitor location and collection method. State the conclusion narrowly. For example: “In this cleaned July 2023 dataset, Station 0031 had the most days above the selected threshold.” Do not claim that its surrounding neighborhood had the county’s worst personal exposure. A monitor represents one location, and weather, gaps, and uneven station coverage limit broader conclusions.
