
Climate Clues: Comparing World Regions
Students use maps, graphs, and short informational texts to compare temperature and precipitation patterns in two world regions.

Illustrations are auto-generated and may be placeholders. They can be refreshed to match the narration.
Weather or Climate?
Weather describes what the air and sky are like at a certain time and place. For example, a rainy, 70°F afternoon is weather. Weather can change within hours or days. Climate is the usual pattern of weather in a region over many years. Scientists study many years of temperature and precipitation data to describe climate. Precipitation is water that falls from clouds as rain, snow, sleet, or hail. One snowy day does not prove that a place has a cold climate. However, many years of long, snowy winters are evidence of a cold climate. Think of weather as one page in a book. Climate is the pattern you notice after reading the whole book. In this lesson, you will use long-term patterns, not single-day reports, to compare regions.

Locate the Regions
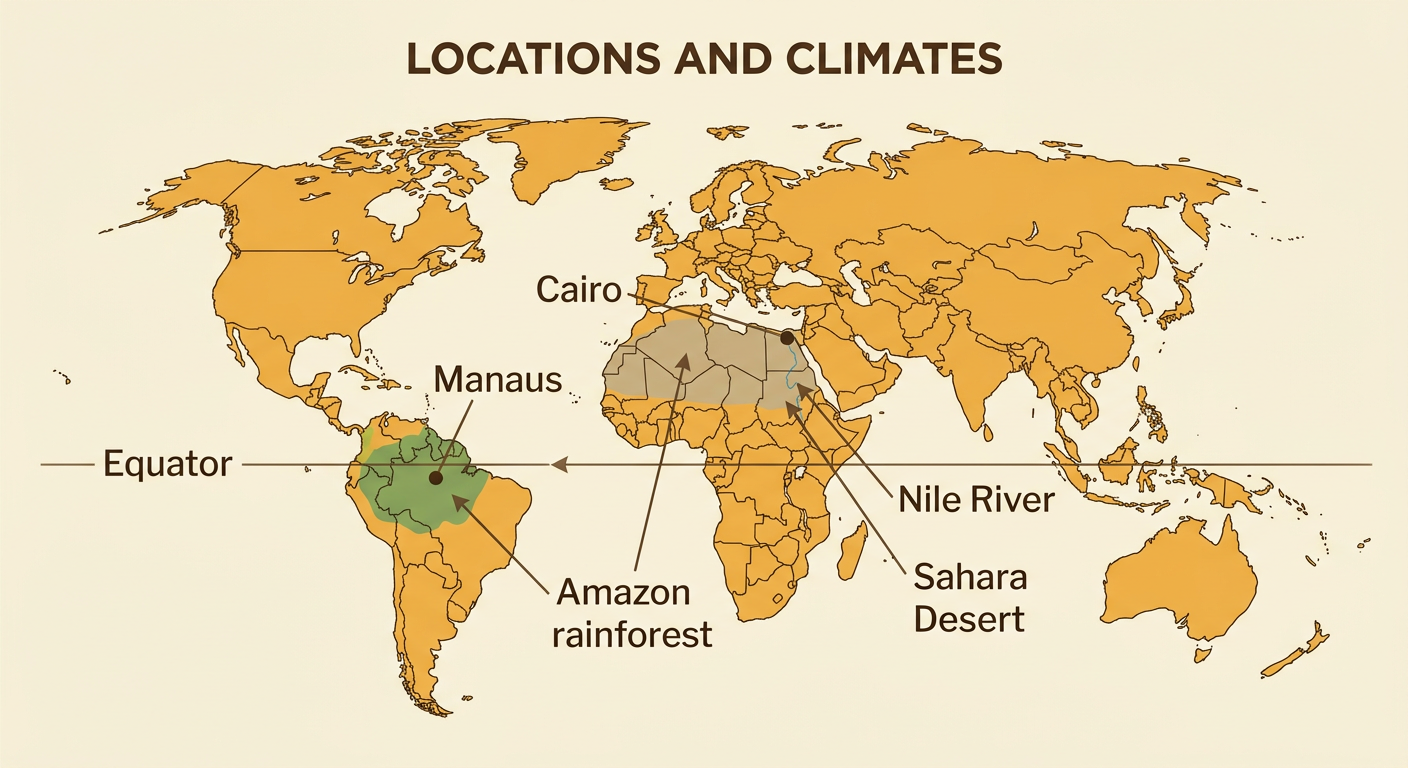
Maps help us locate regions and notice environmental clues. Compare Manaus, Brazil, with Cairo, Egypt. Manaus is in northern South America, close to the Equator and within the Amazon rainforest. It is about 3 degrees south of the Equator. Cairo is in northern Africa, near the Nile River and the Sahara Desert. It is about 30 degrees north of the Equator. The Equator receives strong sunlight throughout the year, helping Manaus stay warm in every season. Cairo is farther from the Equator, so its temperatures change more between winter and summer. The regions also have different sources of moisture. Manaus is surrounded by a wet rainforest with moist air, while Cairo is surrounded by very dry desert land. Location helps explain why world regions do not all have the same climate.
Read Climate Graphs
A climate graph shows average temperature and precipitation for each month. Read the months from left to right along the bottom. Temperature is often shown with a line. Use the temperature scale to find how warm or cool each month is. Precipitation is often shown with bars. Taller bars mean more rain or snow. On a graph for Manaus, the temperature line stays close to 80°F all year. Its precipitation bars are tall in many months, especially from December through May. On a graph for Cairo, the temperature line rises from about 57°F in January to about 83°F in July, then falls again. Cairo’s precipitation bars stay close to zero throughout the year. Always check the title, key, and scales before comparing two graphs because the numbers and units may differ.

Compare Temperature and Precipitation
To compare climates, identify what is alike and what is different. One informational text explains that Manaus is warm and rainy during every month because it is near the Equator and surrounded by rainforest. A second text explains that Cairo is dry all year, with hot summers and milder winters, because it lies in a desert region. Both regions are warm for at least part of the year. However, Manaus has less change in temperature from month to month. Cairo has a larger difference between winter and summer temperatures. The greatest contrast is precipitation: Manaus receives abundant rain, while Cairo receives very little. The texts and graphs support the same important points. Manaus has a warm, wet climate, and Cairo has a hot, dry desert climate. Using more than one source makes the comparison stronger.

Write a Climate Claim
A climate claim is a sentence that answers a question about a region’s usual weather pattern. Support the claim with evidence from maps, graphs, and texts. Then explain how the evidence proves the claim. For example, you might write: “Manaus has a wetter climate than Cairo.” Evidence from the graphs shows that Manaus has precipitation in every month, while Cairo’s bars remain near zero. The map also shows that Manaus is in the Amazon rainforest and Cairo is beside the Sahara Desert. Your reasoning can explain that moist rainforest air supports frequent rain, while dry desert conditions bring little precipitation. Use linking words such as because, while, and therefore. Check that your claim describes climate over many years rather than one day of weather. Strong climate writing includes a clear claim, accurate evidence, and reasoning.
