Climate Evidence: Linking Human Activities to Rising Global Temperatures
Students analyze atmospheric carbon dioxide and temperature data to explain evidence that human activities are influencing recent global temperature increases.
Illustrations are auto-generated and may be placeholders. They can be refreshed to match the narration.
Recent Climate Trends
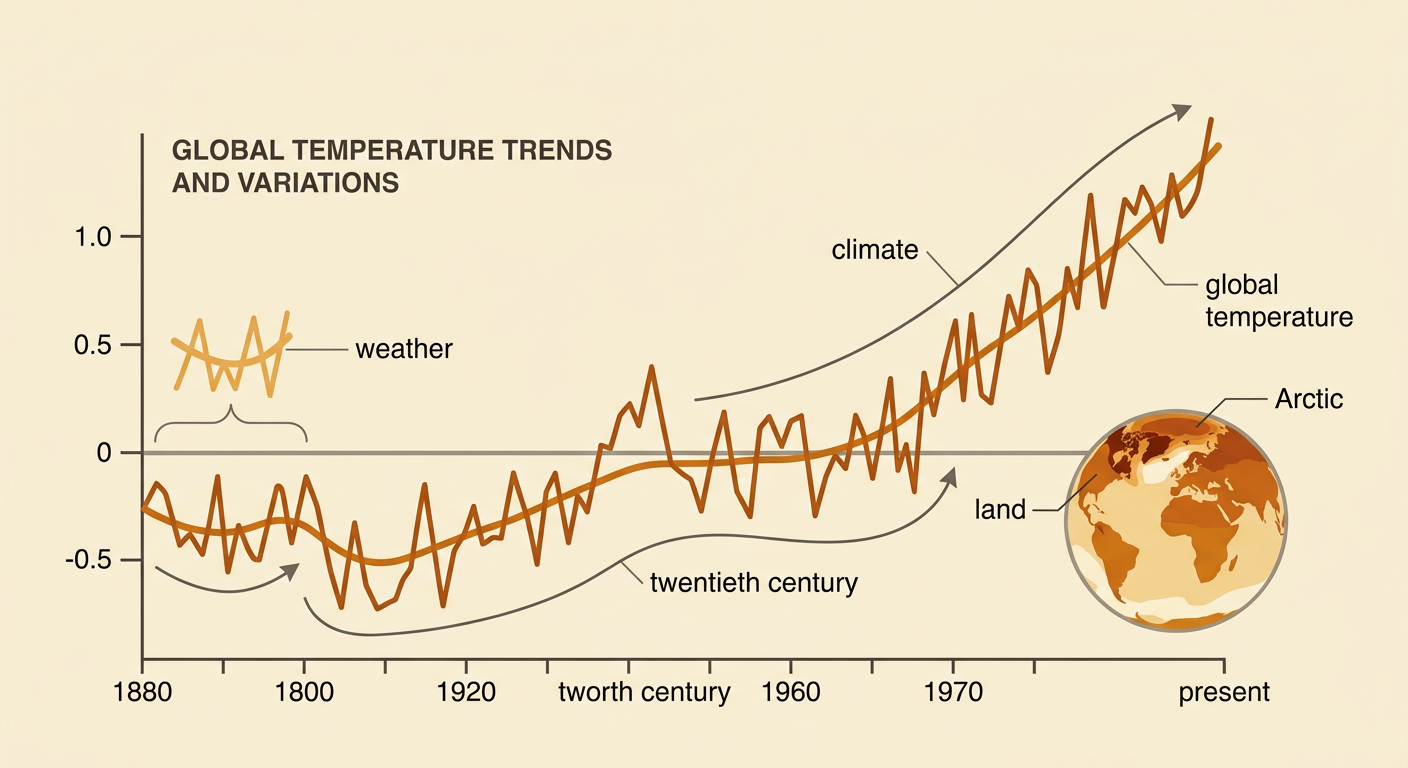
Climate describes long-term patterns, while weather describes conditions over hours or days. Scientists calculate global temperature change by combining measurements from land stations, ships, ocean buoys, and satellites. The records show that Earth’s average surface temperature has risen rapidly since the late 1800s, with most warming occurring after 1970. Recent years have included the warmest years in the instrumental record. Warming is not identical everywhere: land generally warms faster than oceans, and the Arctic warms especially quickly. These changes affect human-environment relationships. For example, repeated coastal flooding or declining mountain snowpack can influence where people build homes, farm, or move. A cold week in one city does not disprove global warming because a local, short-term event must be compared with the long-term global trend.
Human Sources of Greenhouse Gases
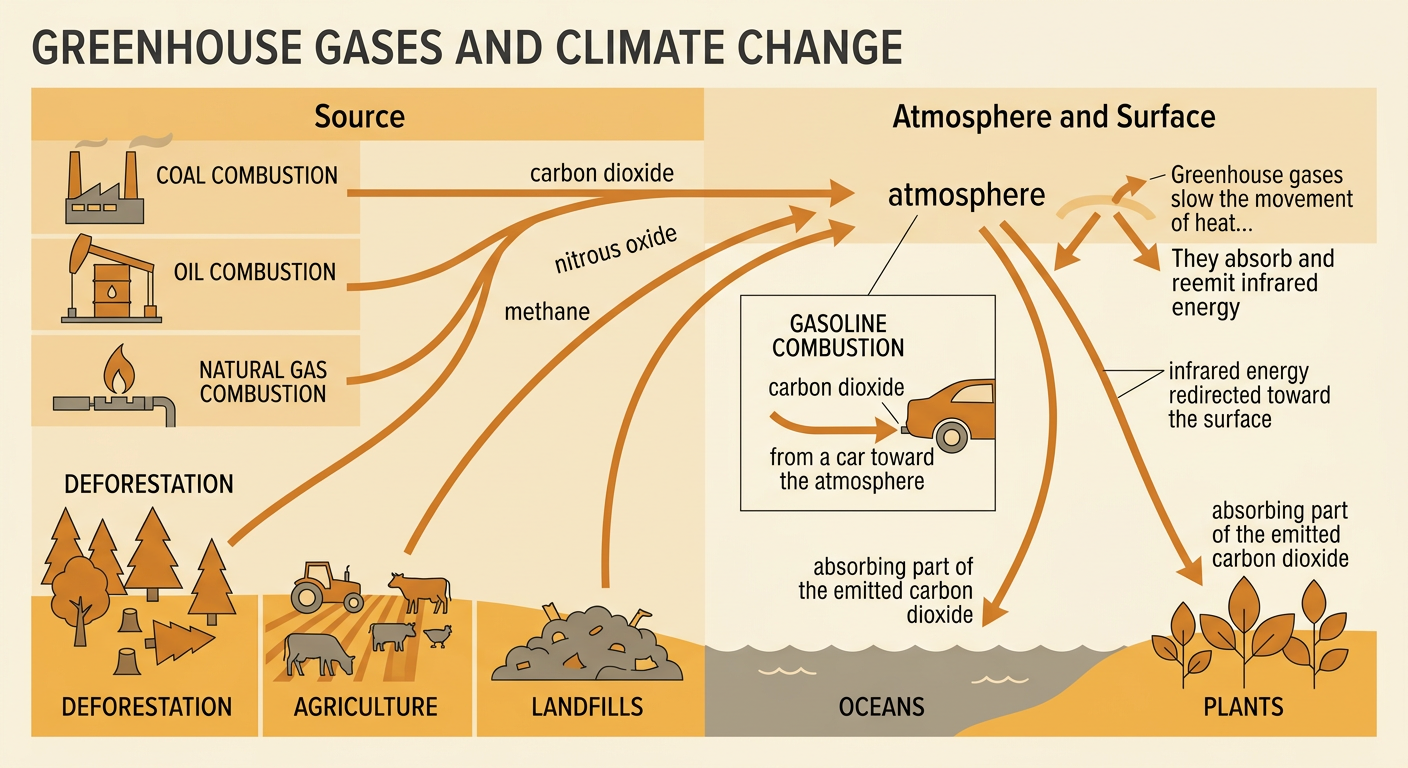
Greenhouse gases absorb and reemit infrared energy, slowing the movement of heat from Earth’s surface to space. Human activities have increased their atmospheric concentrations. Burning coal, oil, and natural gas releases carbon dioxide that was stored underground for millions of years. Deforestation releases carbon from trees and soils while removing plants that could absorb carbon dioxide. Agriculture, landfills, and fossil fuel systems release methane, while fertilizers produce nitrous oxide. For example, when gasoline burns in a car engine, carbon atoms in the fuel combine with oxygen and leave the tailpipe mainly as carbon dioxide. Some emitted carbon dioxide is absorbed by oceans and plants, but much remains in the atmosphere. Energy use, transportation, industry, farming, and land-use choices therefore connect human communities to changes in the global climate system.
Analyzing Carbon Dioxide and Temperature Data
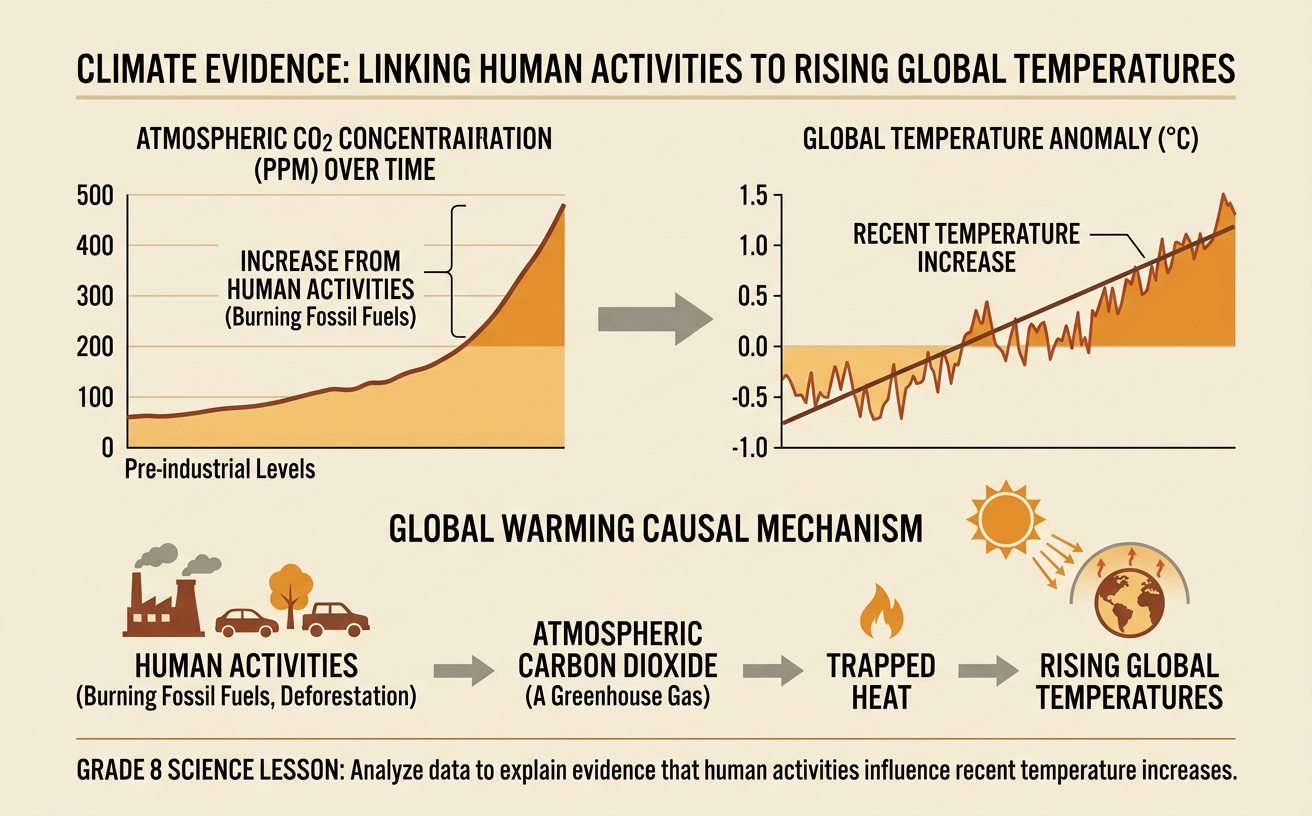
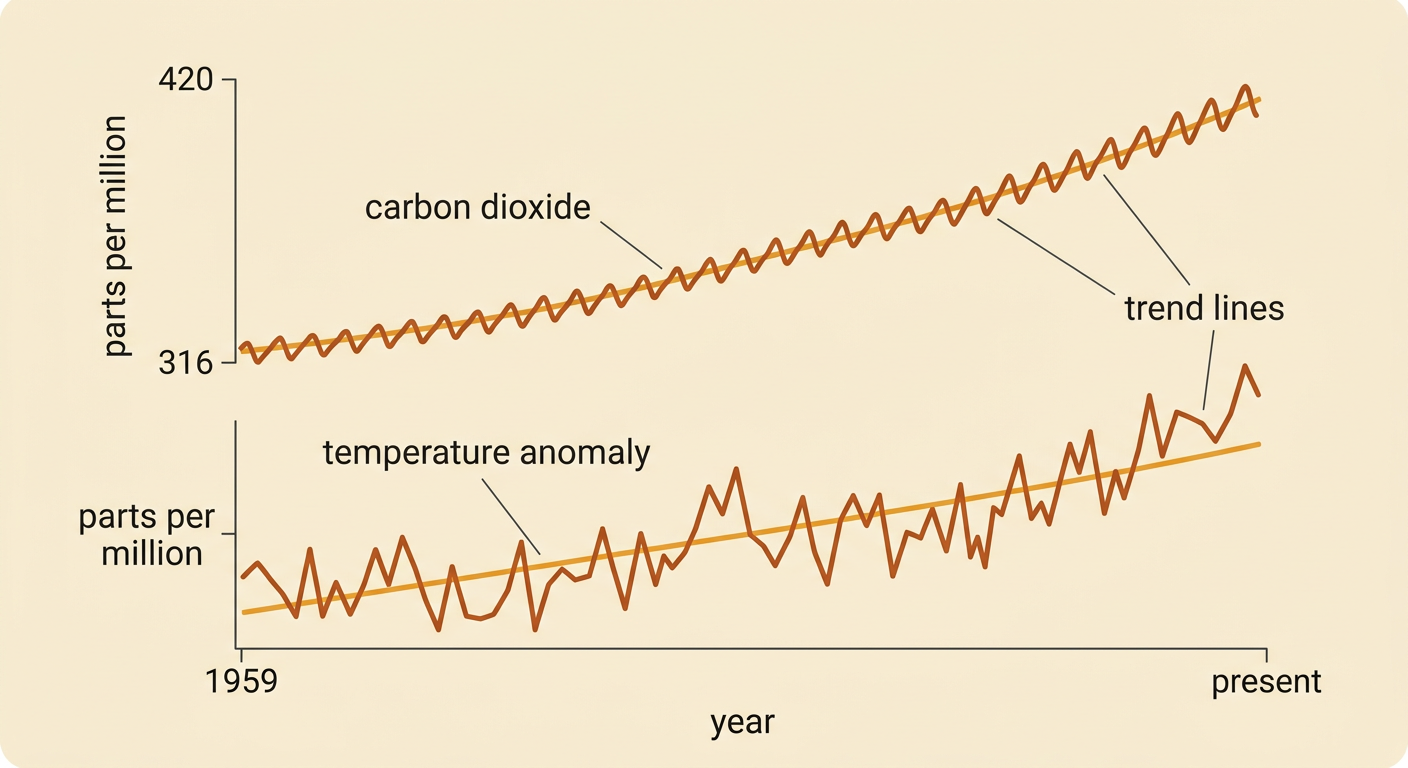
Scientists compare data sets collected over the same time period to identify patterns. Atmospheric carbon dioxide was about 280 parts per million before large-scale industrialization. Direct measurements at Mauna Loa rose from about 316 parts per million in 1959 to more than 420 parts per million in recent years. Over a similar period, global temperature anomalies also increased, although temperatures moved up and down from year to year. Students can model these trends by plotting year on the horizontal axis and using separate, clearly labeled scales for carbon dioxide and temperature. They can calculate changes, compare rates, or draw trend lines. For example, subtracting 316 from 420 shows an increase of more than 100 parts per million since 1959. The two lines should not be expected to match every year because oceans, volcanic eruptions, and natural climate cycles affect short-term temperatures.
Correlation, Mechanisms, and Evidence
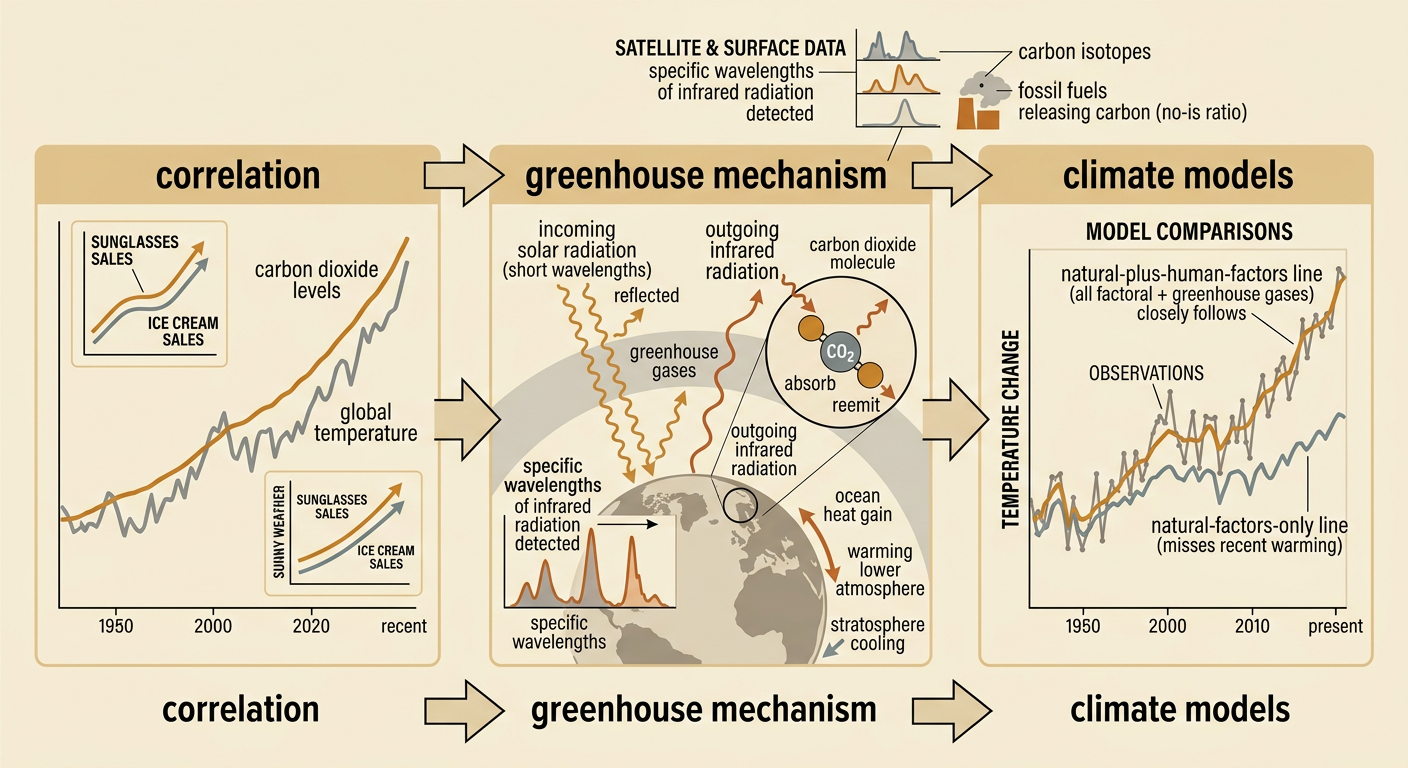
A correlation means that two variables change together, but correlation alone does not prove that one causes the other. A strong explanation also requires a physical mechanism and additional evidence. Laboratory measurements show that carbon dioxide absorbs specific wavelengths of infrared radiation. Satellites and surface instruments detect changes in these wavelengths, supporting the greenhouse mechanism. Carbon isotope measurements indicate that much of the added carbon comes from fossil fuels. Oceans are gaining heat, the lower atmosphere is warming, and the stratosphere is cooling—a pattern expected from increased greenhouse gases rather than a brighter Sun. Scientists also test alternatives. For example, major volcanic eruptions usually cause temporary cooling because particles reflect sunlight. Climate models using only solar and volcanic changes do not reproduce the strong recent warming; models that include human greenhouse gas emissions do much better. Together, these independent findings support causation.
Constructing an Evidence-Based Explanation
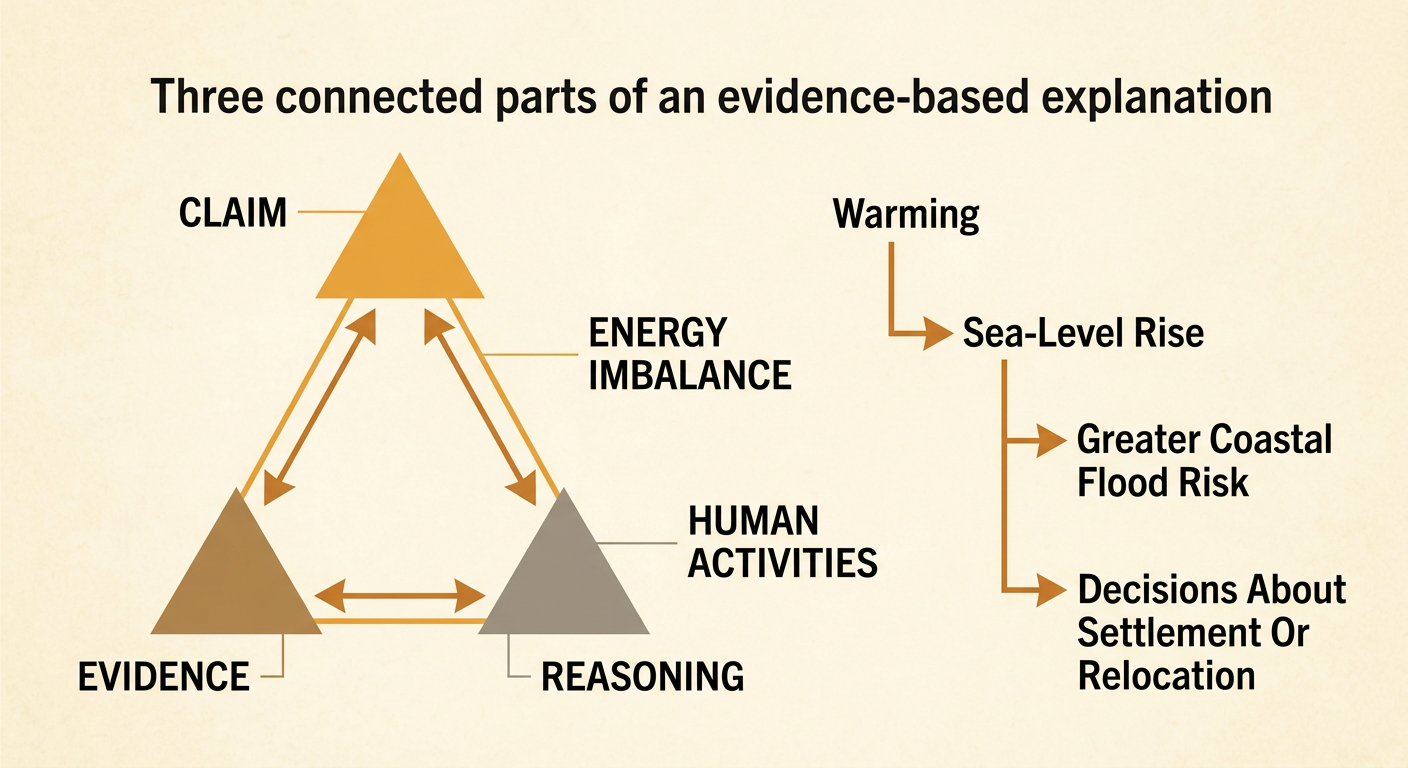
An evidence-based explanation includes a claim, relevant evidence, and reasoning that connects the evidence to the claim. A suitable claim is that human activities are the main cause of the rapid rise in global temperature over the past century. Evidence may include increasing atmospheric carbon dioxide, measured warming, fossil fuel isotope patterns, ocean heat gain, and model comparisons. Reasoning should explain that added greenhouse gases absorb outgoing infrared energy, creating an energy imbalance that warms the climate system. For example, a student might state that carbon dioxide increased by more than 100 parts per million since 1959 while global temperature also trended upward, and that the known greenhouse mechanism explains the connection. The explanation should acknowledge yearly variation and uncertainty without treating them as evidence against the long-term trend. It can also connect warming to shifting coastlines, water supplies, settlement decisions, and possible human movement.