
Climate Models and Evidence of Global Climate Change
Students interpret climate datasets and model projections to explain observed trends, assess uncertainty, and evaluate evidence-based claims about future climate change.

Illustrations are auto-generated and may be placeholders. They can be refreshed to match the narration.
Climate Indicators and Long-Term Trends
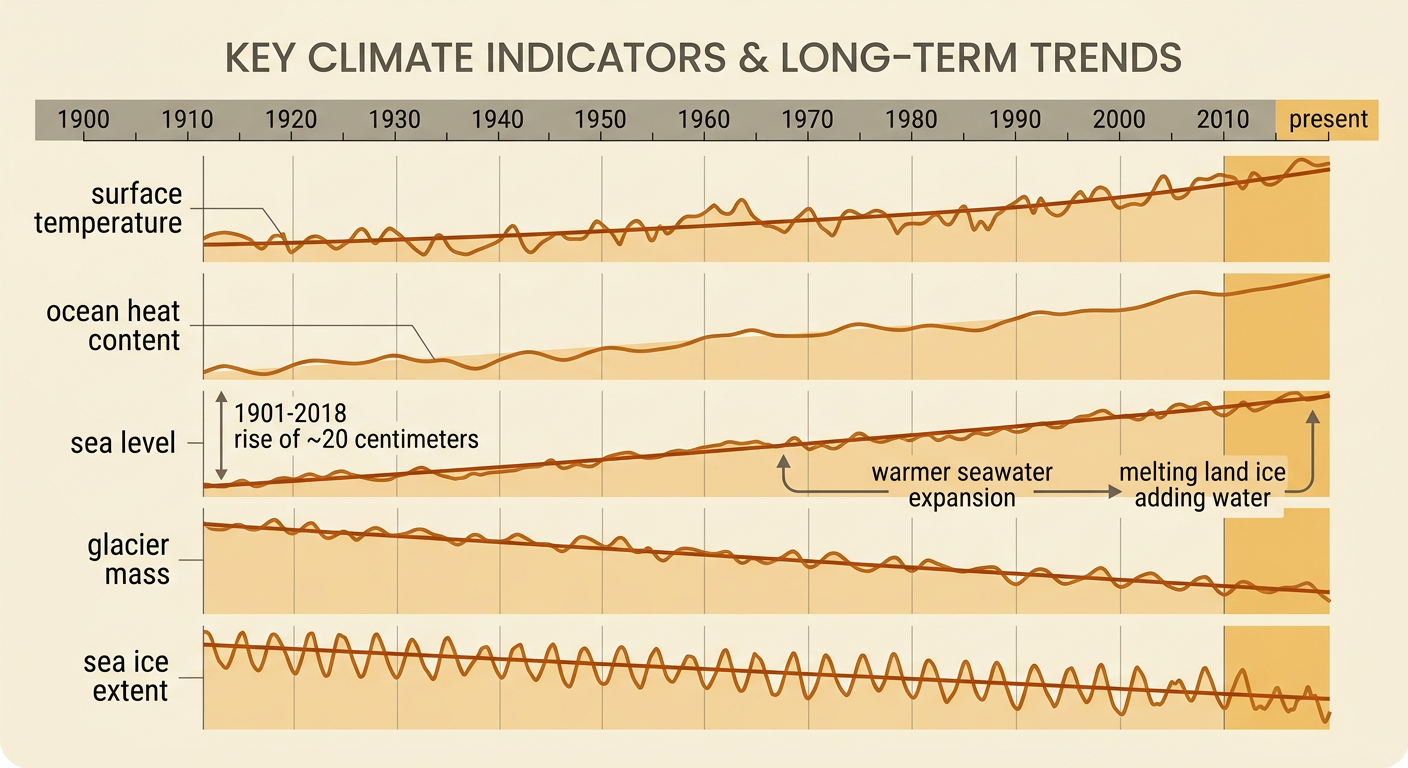
Climate is measured through long-term patterns, not isolated weather events. Scientists examine multiple indicators, including surface temperature, ocean heat content, sea level, glacier mass, sea ice extent, and seasonal biological changes. Independent indicators strengthen a conclusion when they change in physically consistent ways. For example, global mean sea level rose by about 20 centimeters from 1901 to 2018. This trend agrees with evidence that warming seawater expands and melting land ice adds water to the ocean. A cold winter in one region does not disprove global warming because weather varies over days or seasons, while climate trends are evaluated over decades and across large areas. Scientists also compare modern measurements with evidence from tree rings, ice cores, sediments, and corals to place recent changes in a longer historical context.
Reading Temperature and Carbon Dioxide Data
Temperature graphs often show anomalies, which are differences from an average temperature during a stated reference period. An anomaly of 1 degree Celsius means the measured temperature was 1 degree above that baseline, not that the actual temperature was 1 degree. Carbon dioxide is measured in parts per million, or ppm. At Mauna Loa, atmospheric carbon dioxide increased from about 315 ppm in 1958 to more than 420 ppm in recent years. The record also has a seasonal zigzag caused mainly by Northern Hemisphere plant growth and decay. When comparing carbon dioxide and temperature graphs, check the axes, dates, units, and trend lines. Their shared upward pattern shows correlation, but correlation alone does not establish cause. Laboratory measurements, atmospheric observations, and energy-balance physics provide additional evidence that carbon dioxide absorbs outgoing infrared radiation and contributes to warming.

How Climate Models Produce Projections
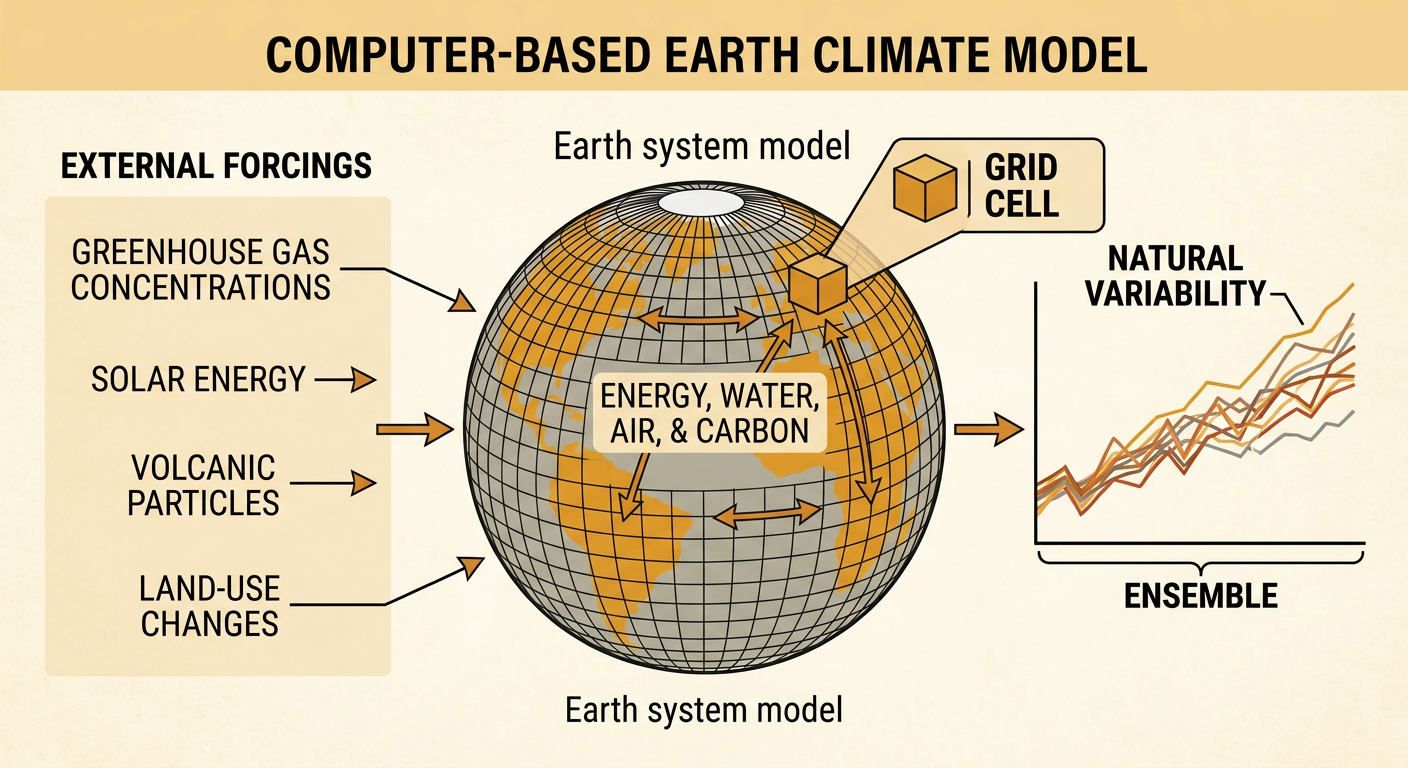
Climate models are computer-based representations of Earth’s climate system. They divide the atmosphere, ocean, land, and ice into three-dimensional grid cells and calculate how energy, water, air, and carbon move among them. The calculations use physical laws, including conservation of energy and momentum. Scientists supply external forcings such as solar energy, volcanic particles, greenhouse gas concentrations, and land-use changes. Models are tested by asking whether they reproduce past climate patterns that were not used to tune every model feature. For example, simulations using both natural and human-caused forcings reproduce much of the observed twentieth- and twenty-first-century warming. Simulations using only solar and volcanic influences do not reproduce the strong recent warming trend. Researchers run models many times with slightly different starting conditions to form ensembles, which reveal the range of possible outcomes produced by natural variability.
Comparing Emissions Scenarios
An emissions scenario is a plausible pathway for future greenhouse gas emissions based on assumptions about population, energy, technology, land use, and policy. It is not a prediction that one pathway must occur. A low-emissions scenario assumes rapid reductions and eventually very low net carbon dioxide emissions. A high-emissions scenario assumes continued heavy reliance on fossil fuels and much larger emissions. Model projections remain relatively close in the near term because of past emissions and climate-system inertia, but they separate more strongly later in the century. For example, a coastal city may face rising flood risk under every scenario, while the frequency and severity of flooding become much greater under a high-emissions pathway. Scenario comparisons help communities evaluate choices involving seawalls, building locations, water systems, agriculture, public health, and migration. Human decisions influence which projected pathway becomes most relevant.

Uncertainty, Confidence, and Model Limitations
Uncertainty means that a value or outcome is expressed as a range rather than known exactly. It does not mean scientists know nothing. Climate uncertainty comes from future human choices, natural variability, measurement limits, and differences in how models represent processes. Scientists estimate it by comparing models, observations, scenarios, and repeated ensemble runs. Confidence describes how strongly evidence and scientific agreement support a conclusion. Models generally provide greater confidence in global, long-term temperature trends than in local, short-term precipitation changes. For example, models consistently project a warmer global climate as greenhouse gas concentrations rise, but they may disagree about how annual rainfall will change in a particular county. Clouds, storms, ocean circulation, and ice-sheet behavior can be difficult to represent at small scales. Therefore, a projection should include its location, time period, scenario, range, and level of confidence.

Evidence-Based Climate Conclusions
An evidence-based climate conclusion connects a specific claim to relevant data and scientific reasoning. Begin by identifying the time span, geographic scale, variables, units, and comparison baseline. Then determine whether multiple independent datasets support the same pattern. A strong claim also acknowledges uncertainty and avoids extending evidence beyond what it can support. For example, rising greenhouse gas concentrations, measured warming, increasing ocean heat, melting land ice, and model attribution studies support the conclusion that human activities are the primary cause of recent global warming. A single hurricane cannot be said to have been caused only by climate change. However, observations and models can test whether warming made certain storm conditions, such as heavier rainfall, more likely or intense. Conclusions should also connect physical changes to people, such as heat exposure, crop stress, water shortages, coastal flooding, infrastructure damage, and displacement.
