Code a Natural-Hazard Data Filter
Students use variables, comparison operators, and conditional statements to filter a small natural-hazard dataset and test whether the program correctly identifies communities needing preparedness support.
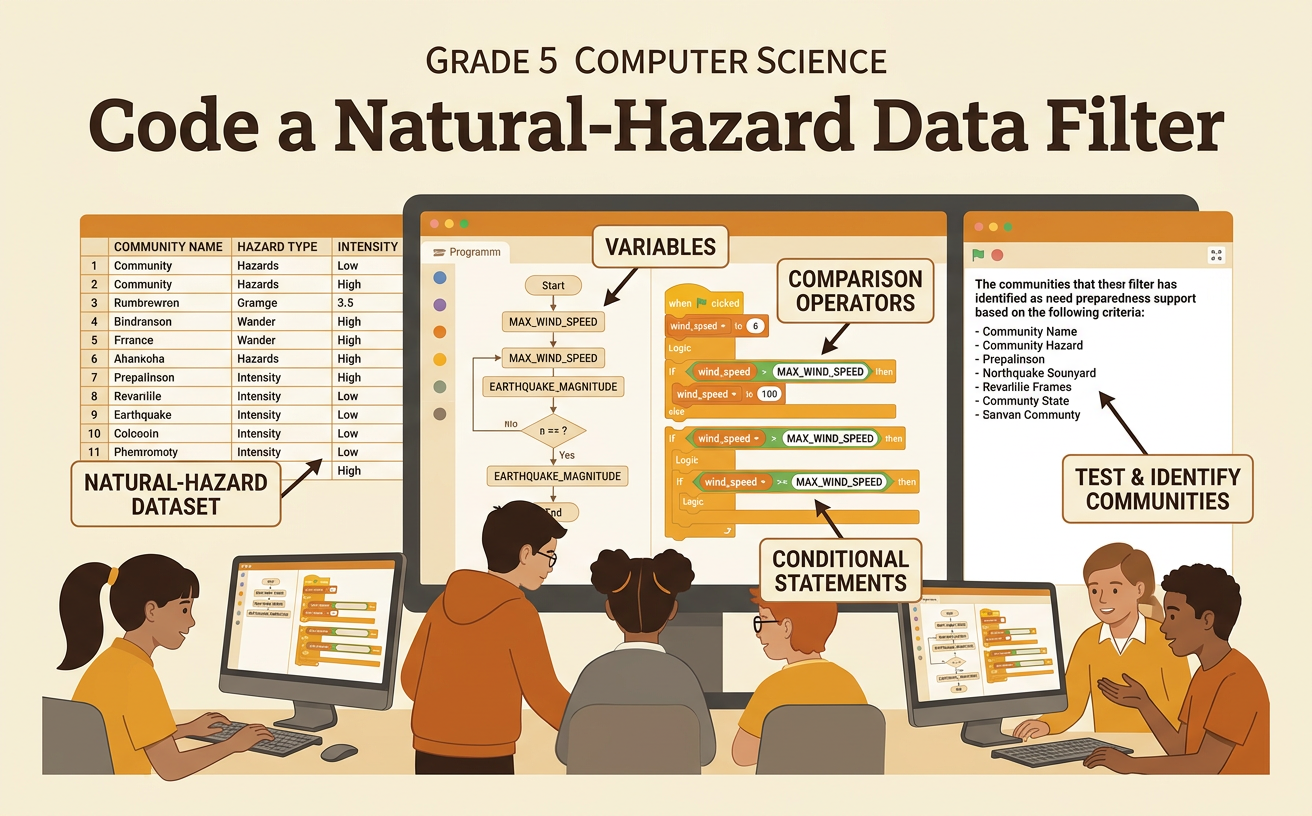
Illustrations are auto-generated and may be placeholders. They can be refreshed to match the narration.
Explore the Hazard Dataset
A dataset is an organized collection of information. In this lesson, each record describes one community and its possible hazard risk. The columns show the community name, hazard type, risk level, population, and whether the community has an emergency plan. Read across one row to connect facts about the same place. For example, Pine Town may have a flood risk level of 8, a population of 2,400, and no emergency plan. River City may have a flood risk level of 4, a population of 5,100, and an emergency plan. Use the column headings and a hazard map together to answer questions efficiently. Notice that the data describes possible needs; it does not predict exactly when a disaster will happen. Accurate data helps people decide where preparedness support may be useful.

Identify Variables and Conditions
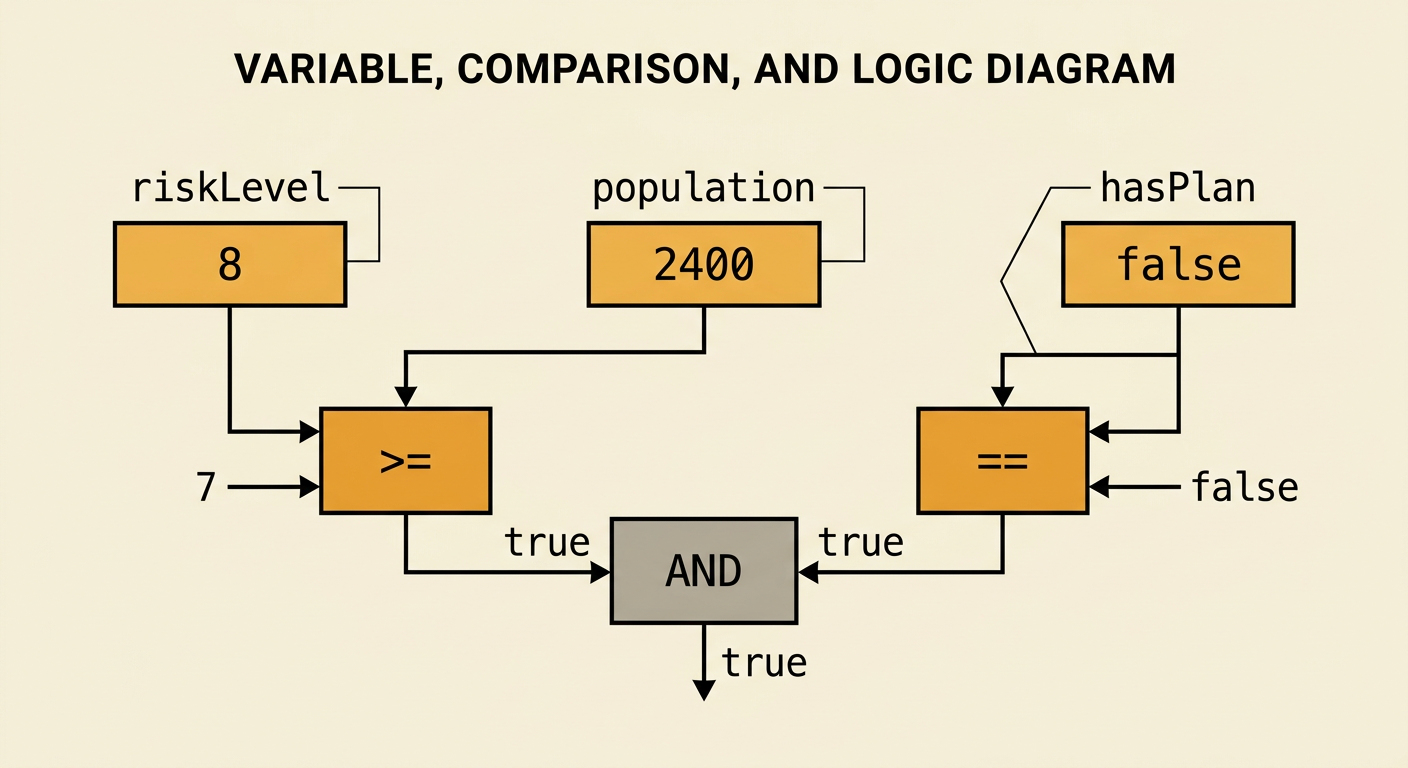
A variable is a named place where a program stores a value. For one community record, the program might store riskLevel = 8, population = 2400, and hasPlan = false. A comparison operator checks how two values relate. The operator >= means greater than or equal to, while == means equal to. A condition is a statement that can be true or false. For example, riskLevel >= 7 is true when the risk level is 7, 8, 9, or 10. To identify communities that may need support, use the condition riskLevel >= 7 AND hasPlan == false. AND means both comparisons must be true. Keeping population unchanged while testing this condition helps students see exactly how risk level and plan status affect the result.
Build the Data Filter
A conditional statement tells a program what to do when a condition is true and what to do otherwise. For each record, load the values into variables. Then check: if riskLevel >= 7 AND hasPlan == false, label the community “Preparedness support needed.” Otherwise, label it “Does not meet this filter.” Imagine Cedar Village has a wildfire risk level of 9 and no emergency plan. Both comparisons are true, so the program adds Cedar Village to the support list. If Lake Borough has a risk level of 9 but already has a plan, the second comparison is false, so it is not added. This filter is a simple model, not a complete decision by itself. Real planners would also consider current warnings, accessibility, available resources, and guidance from local experts.

Test with Sample Records
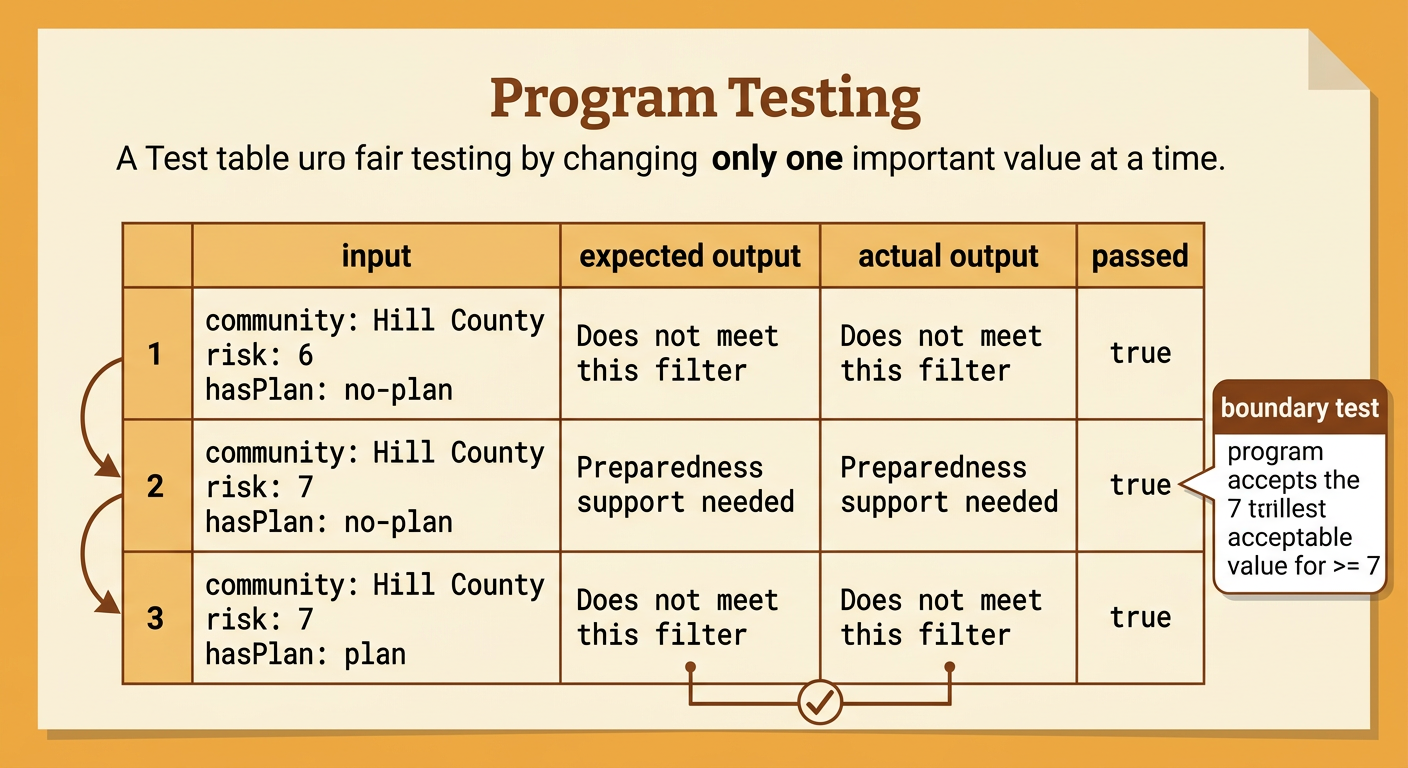
Testing checks whether the filter works as intended. Use several sample records and change only one important variable at a time when possible. This makes the test fair because it reveals which value caused the output to change. Start with Hill County: risk level 6 and no plan. The expected result is “Does not meet this filter.” Next, keep the plan status the same but change the risk level to 7. The expected result becomes “Preparedness support needed.” This boundary test is important because 7 is the smallest value accepted by >= 7. Then test risk level 7 with a plan. The expected result changes back to “Does not meet this filter.” Record the input, expected output, actual output, and whether the test passed. Include low, boundary, high, plan, and no-plan cases.
Debug Incorrect Results
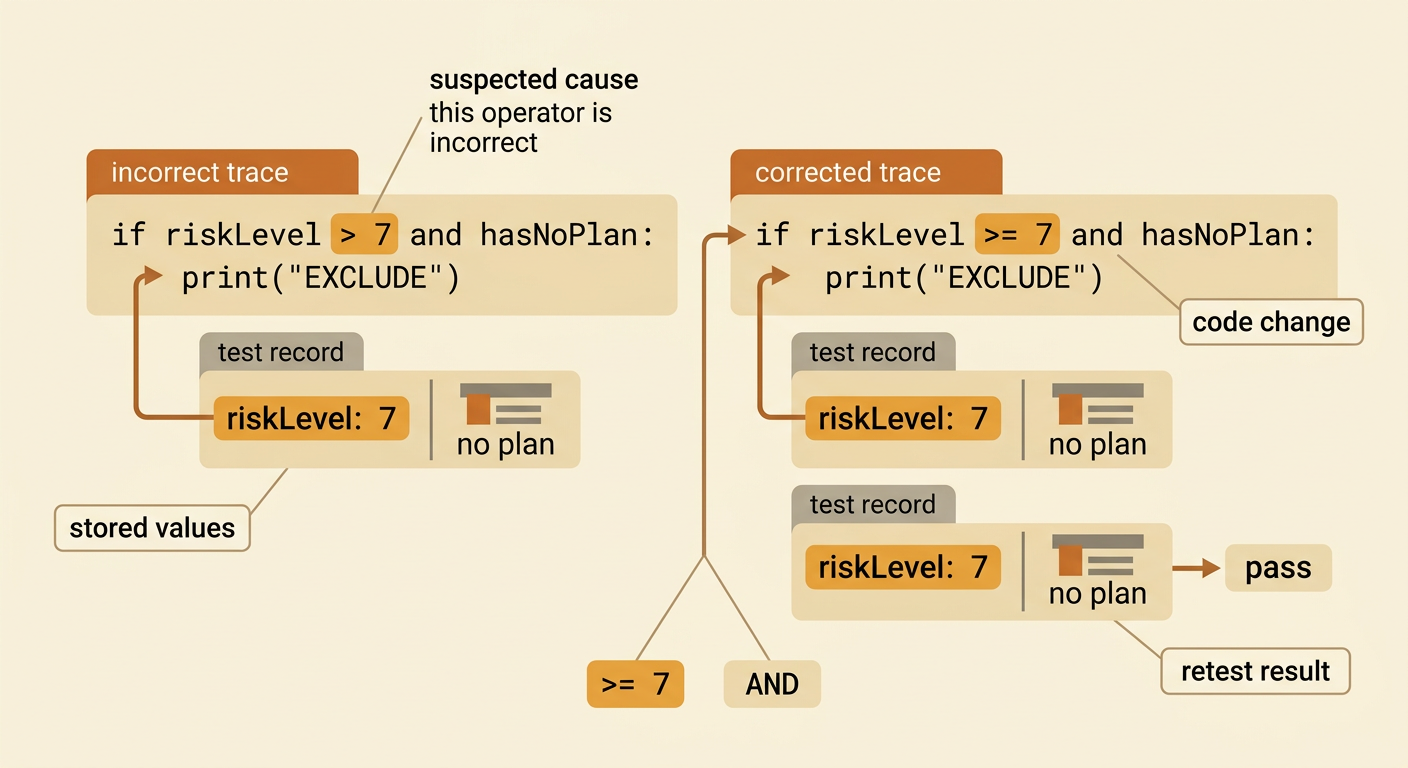
Debugging means finding and fixing a problem in a program. When an actual output does not match the expected output, trace the record through each step. Suppose a community with risk level 7 and no plan is incorrectly excluded. Check the stored values first. Then inspect the comparison operator. If the code says riskLevel > 7, the value 7 will fail because > does not include equality. Change it to riskLevel >= 7 and run all test cases again. Another failure point could be using OR instead of AND. OR would include a low-risk community simply because it has no plan. Fix one issue at a time, repeat the same tests, and look for new problems. Keep a short debugging log that names the failed case, suspected cause, code change, and retest result.
Discuss Community Preparedness
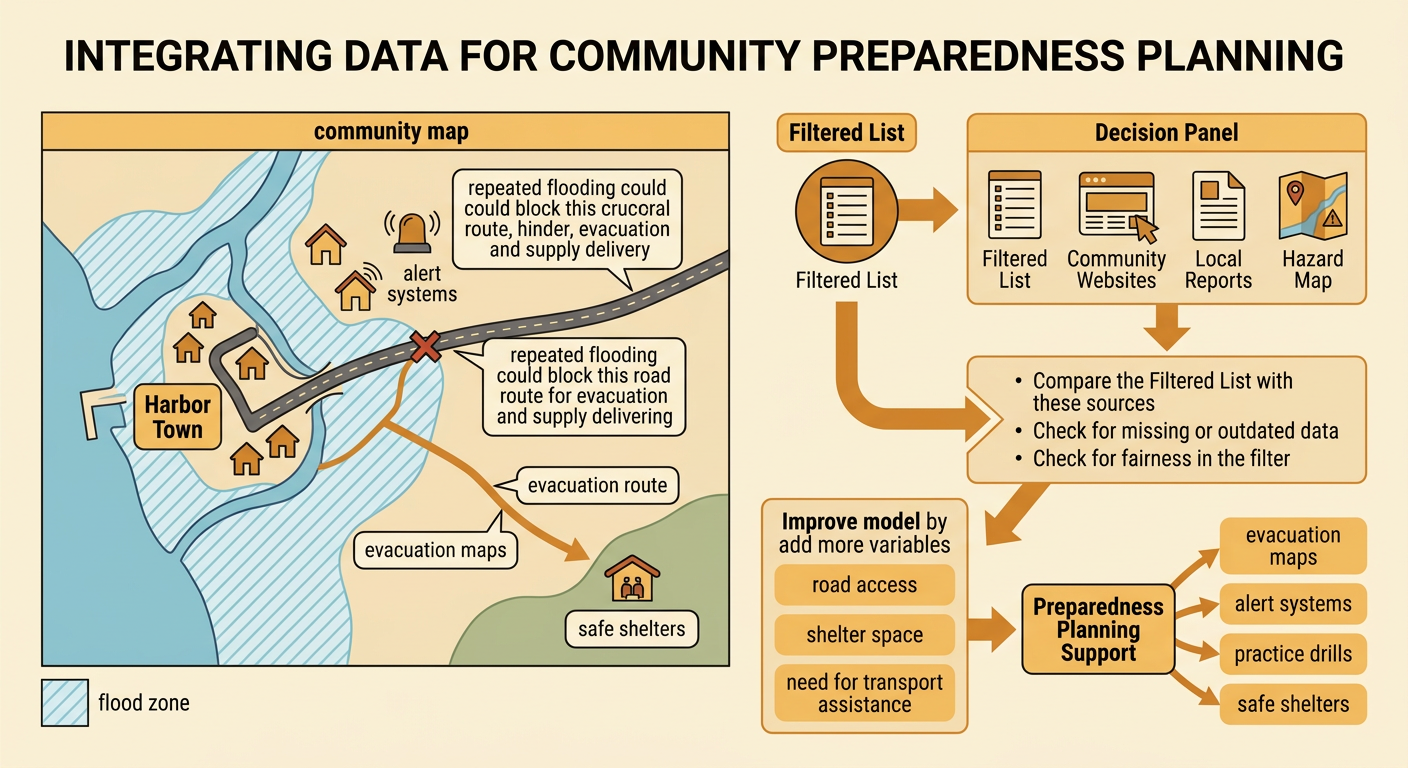
The filtered list can help people ask where preparedness support may be needed, but code should not make the final decision alone. Natural hazards can damage homes, roads, water systems, and communication networks. They may also cause people to leave temporarily or move permanently. For example, repeated flooding could block the only road to Harbor Town, making evacuation and supply delivery difficult. A high-risk community without an emergency plan might benefit from evacuation maps, alert systems, practice drills, or safe shelter information. Compare the dataset with a hazard map, community websites, and reliable local reports before drawing conclusions. Also look for missing or outdated data. Discuss whether the filter treats communities fairly and what additional variables could improve it, such as road access, number of shelters, or residents who need transportation assistance.