Code a Water-Saving Simulation with Loops
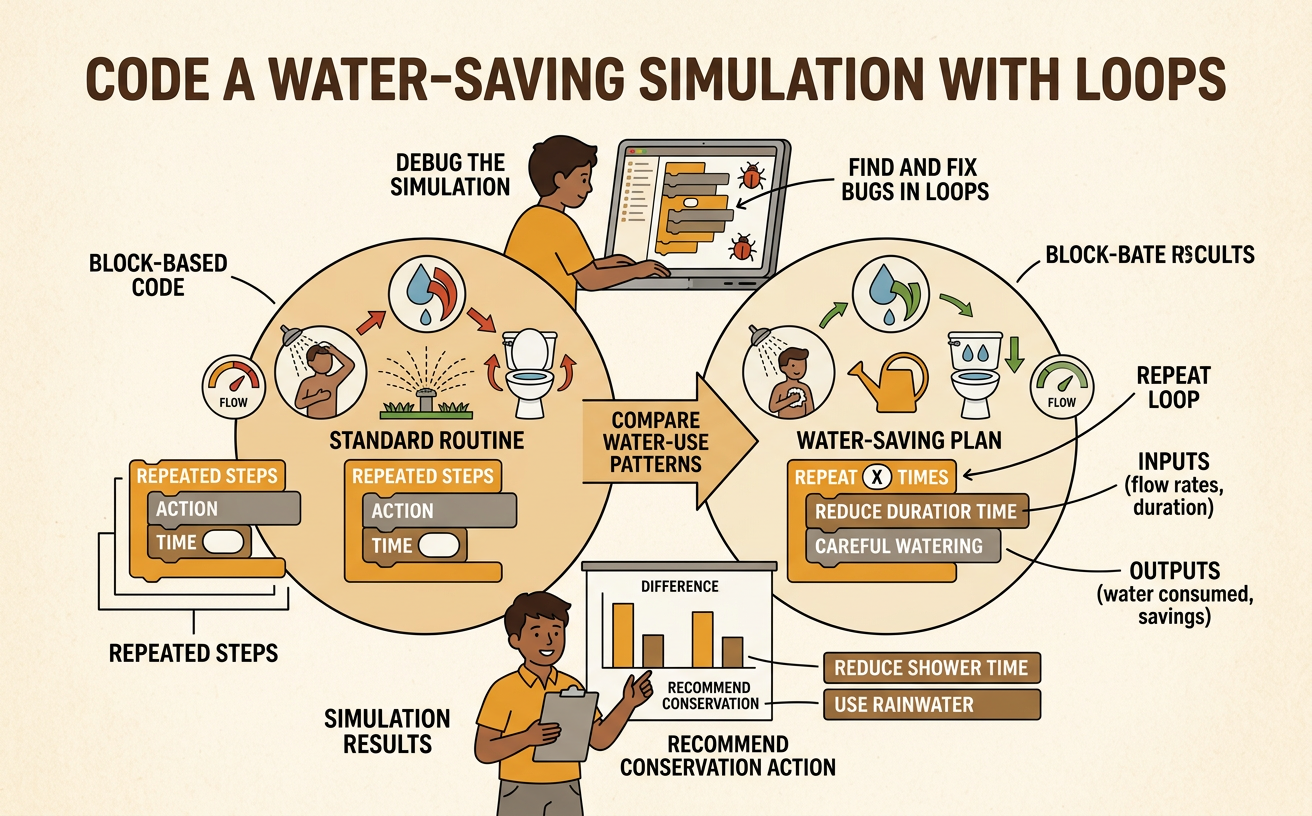
Students use block-based code and a repeat loop to compare water-use patterns, debug the simulation, and recommend a conservation action based on the results.
Illustrations are auto-generated and may be placeholders. They can be refreshed to match the narration.
Introduce the Water-Use Problem
Fresh water is a limited resource, so communities look for ways to reduce waste. Imagine a faucet that uses 2 gallons of water each minute. If it runs for 5 minutes, the amount used grows every minute. A water-saving faucet uses only 1 gallon per minute. Our goal is to code a simulation that compares these two patterns. The simulation will help answer a question: How much water could be saved during five minutes by using the water-saving faucet? Before coding, predict the results with a partner. Discuss which information the program needs, such as the number of minutes and the gallons used each minute. Listen to your partner’s reasoning, ask questions, and agree on a prediction that you can test.
Trace a Repeating Algorithm
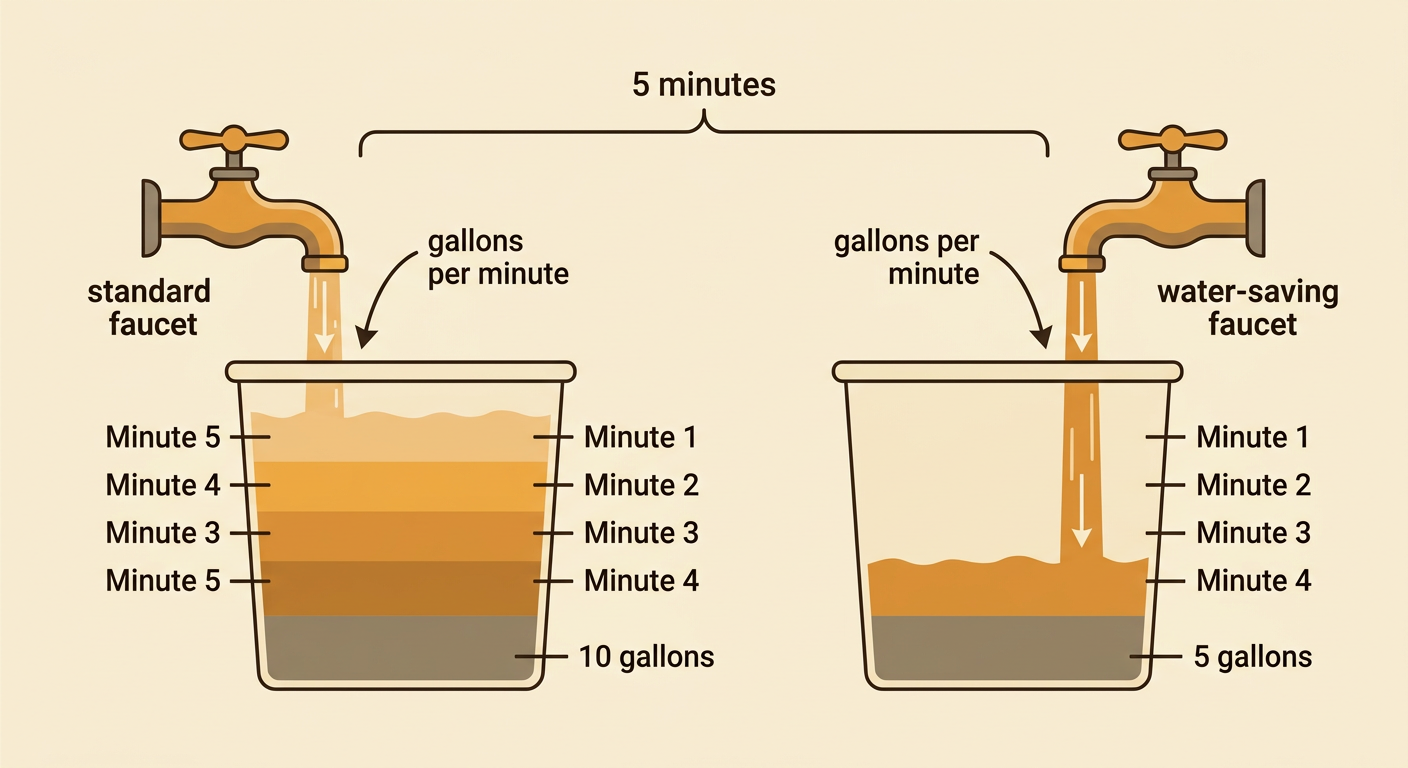
An algorithm is a set of steps for solving a problem. A repeat loop tells a program to perform the same steps a certain number of times. For the standard faucet, begin with a total of 0 gallons. Repeat five times: add 2 gallons to the total, increase the minute by 1, and report the new total. The totals form the pattern 2, 4, 6, 8, 10. Each number is 2 greater than the previous number. For the water-saving faucet, add 1 gallon during each repetition. Its pattern is 1, 2, 3, 4, 5. Trace both algorithms by pointing to each repeated step and recording the changing values. This helps you understand what the code should do before you build it.

Build the Loop-Based Simulation
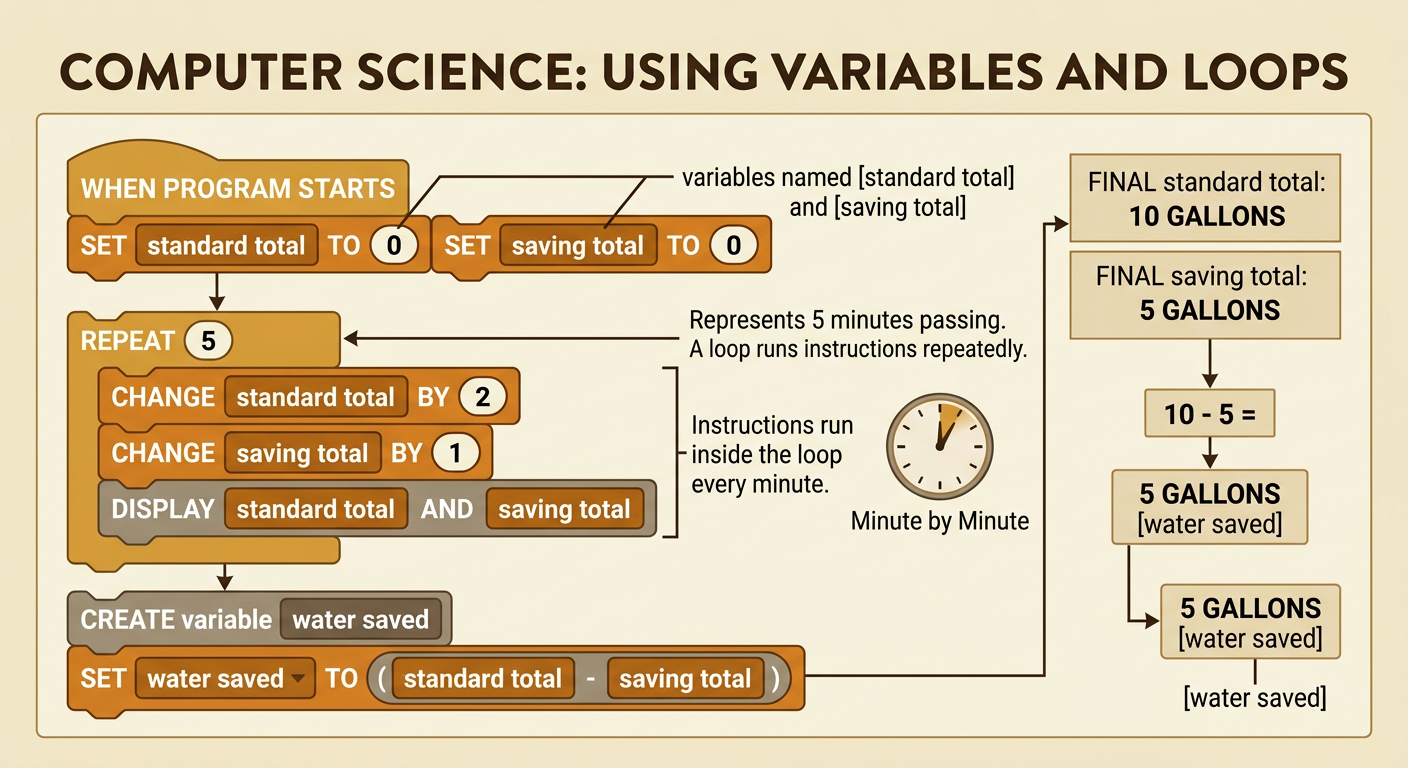
Create two variables named standard total and saving total, and set both to 0. Add a repeat 5 block. Inside the loop, change standard total by 2 and change saving total by 1. Then display or record both totals. The program repeats these instructions once for each minute. After the loop ends, create a third variable named water saved. Set it equal to standard total minus saving total. In this example, the final standard total is 10 gallons, the saving total is 5 gallons, and the water saved is 5 gallons. Work with a partner while building. One person can place the blocks, while the other checks that every block is in the correct order and inside the loop. Then switch roles.
Test and Debug the Code
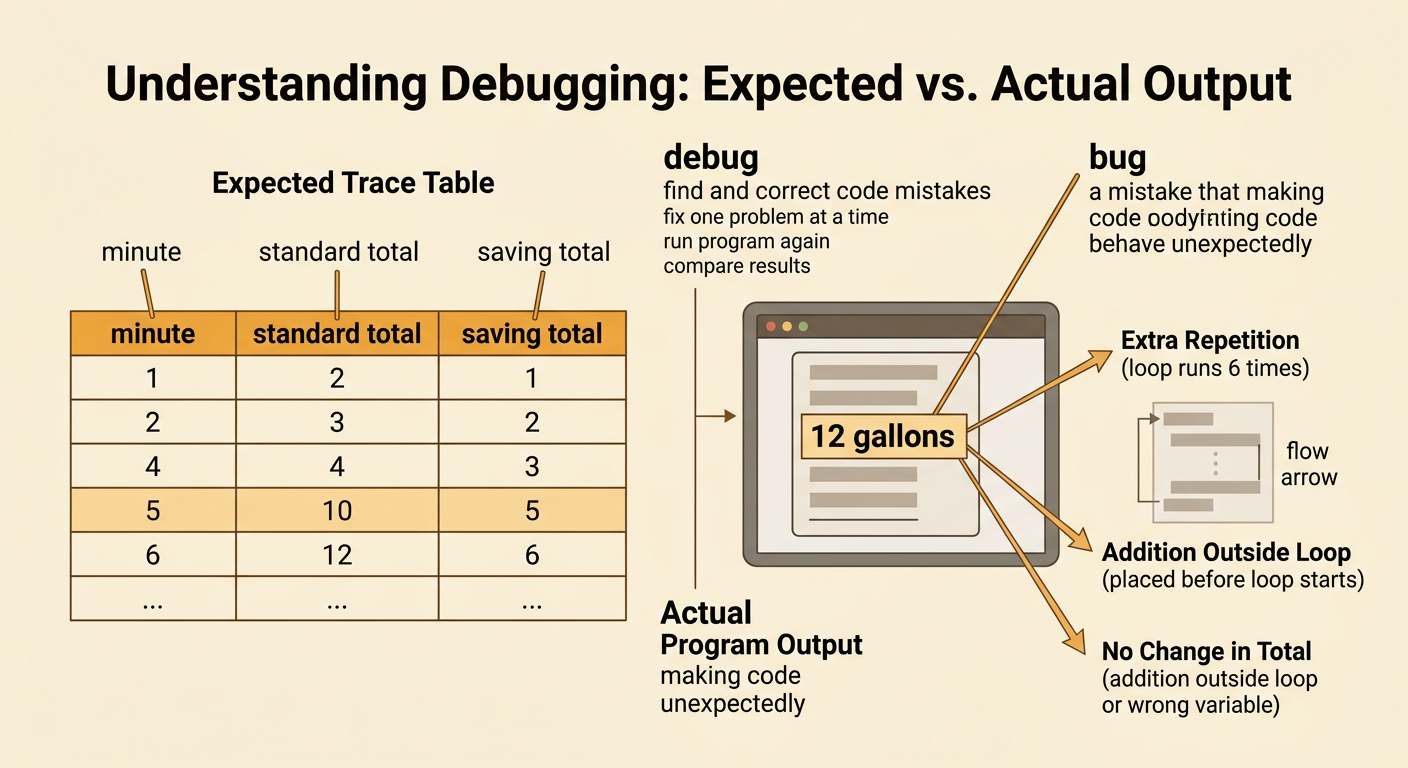
Testing means running the program and checking whether its output matches the expected pattern. Make a trace table with columns for minute, standard total, and saving total. After minute 1, the totals should be 2 and 1. After minute 5, they should be 10 and 5. If the program reports 12 gallons for the standard faucet, look for a bug. The loop may be repeating six times, or 2 gallons may have been added before the loop began. If the total never changes, the addition block may be outside the loop or may change the wrong variable. Fix one problem at a time, run the program again, and compare every output with the trace table. Explain the bug and the correction to your partner so both of you understand the solution.
Compare Patterns and Recommend an Action
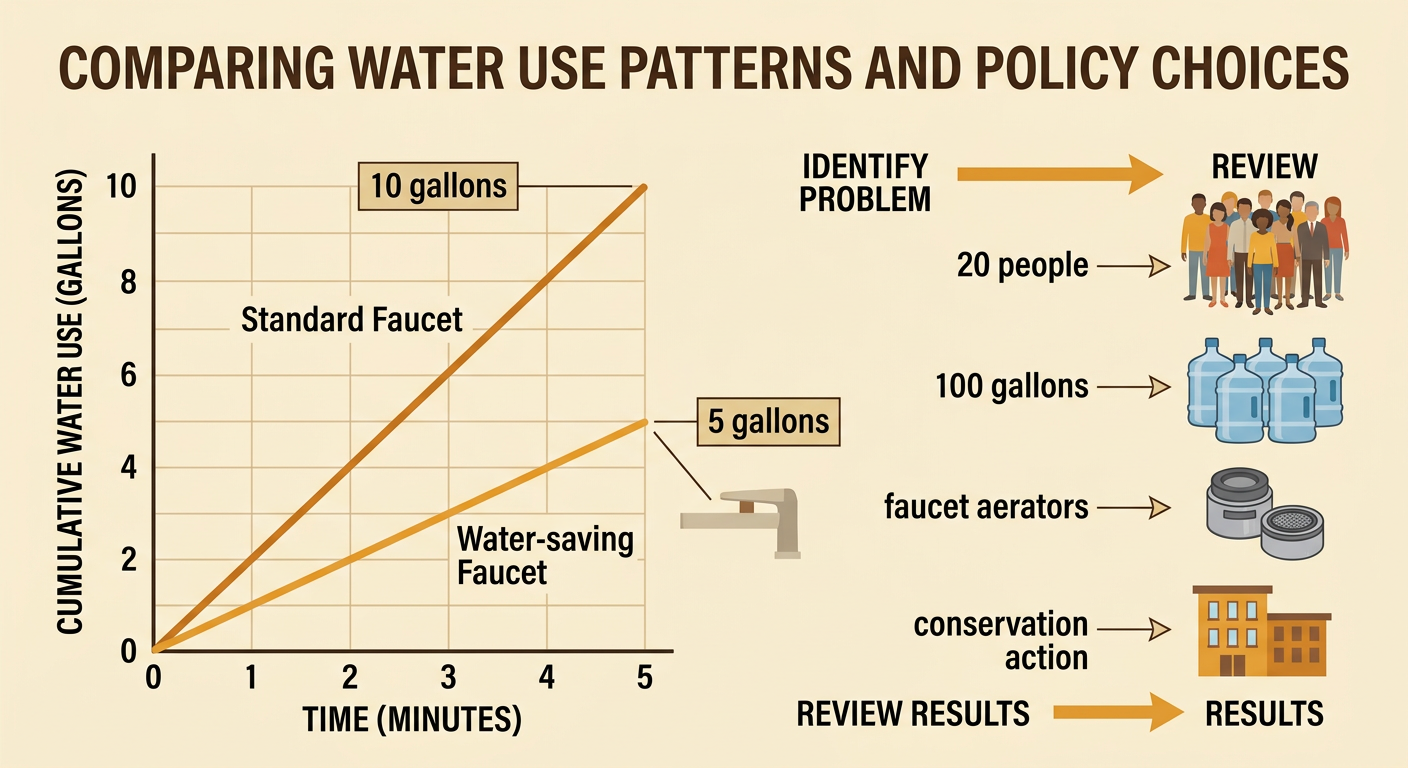
Use the final outputs to compare the two patterns. The standard faucet totals increase by 2 gallons each minute, while the water-saving totals increase by 1 gallon each minute. After five minutes, the water-saving faucet uses 5 fewer gallons. If 20 people each used it for five minutes, the community could save 100 gallons because 20 times 5 equals 100. Based on this evidence, recommend an action such as installing water-saving faucet aerators in a school or community building. Explain the benefit, cost, and possible concerns during a group discussion. A community policy might be developed by identifying the water-waste problem, gathering evidence, hearing public opinions, choosing a solution, and reviewing the results. Your simulation provides scientific and mathematical evidence that can help people make a responsible decision.