Coding and Debugging a Carbon Emissions Model
Students use variables, loops, and test cases to build and debug a simple program that models how different annual emissions rates affect cumulative carbon emissions over time.

Illustrations are auto-generated and may be placeholders. They can be refreshed to match the narration.
Define the Model and Variables
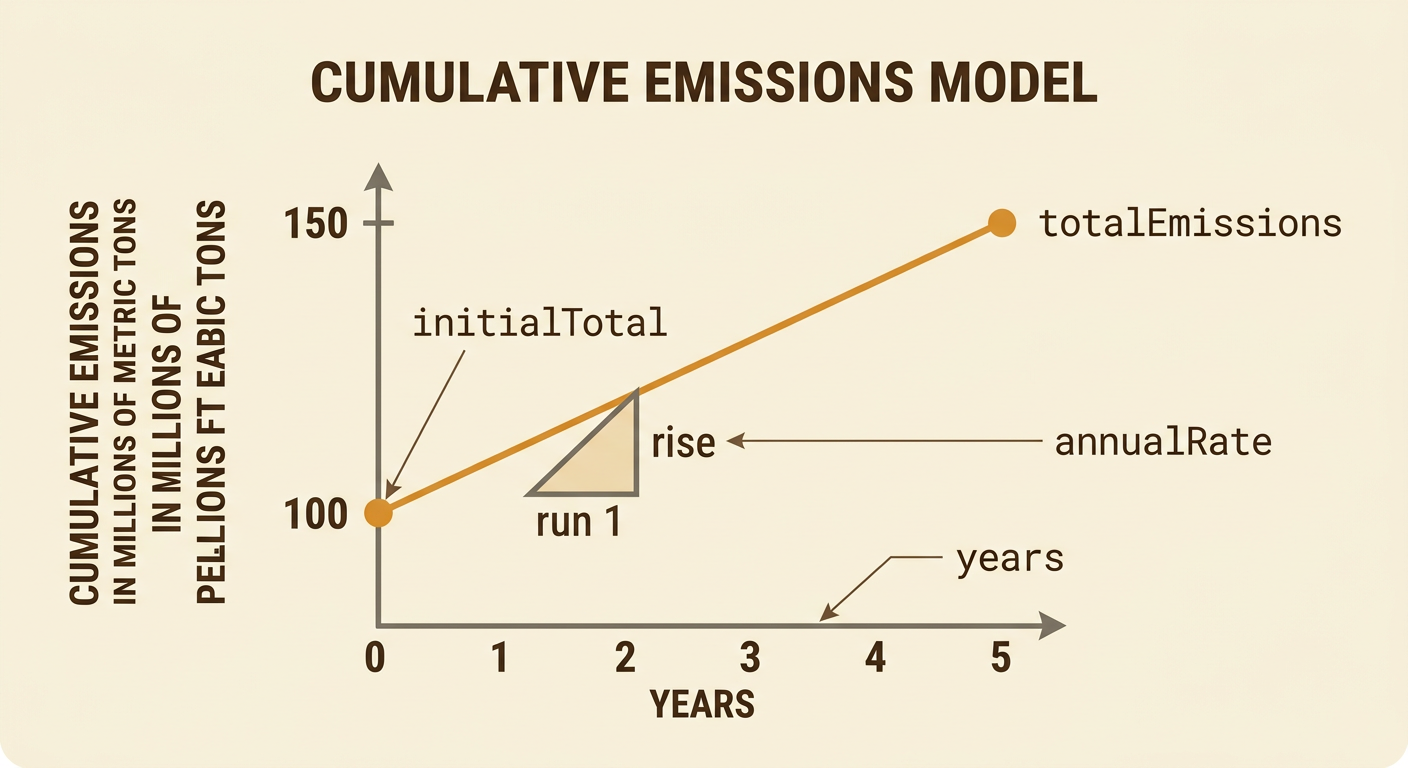
A model is a simplified representation used to explore a question. Here, the question is: How does an annual emissions rate affect cumulative carbon emissions over time? Define initialTotal as the emissions already accumulated when the model begins, annualRate as the carbon emitted each year, and years as the length of the simulation. The output, totalEmissions, can be represented by the linear function totalEmissions = initialTotal + annualRate × years. The annualRate is the rate of change, or slope, and initialTotal is the initial value. For example, if initialTotal is 100 million metric tons and annualRate is 10 million metric tons per year, then after 5 years the model predicts 150 million metric tons. Keep all units consistent so the calculation has a clear meaning.
Code a Repeating Yearly Update
A loop allows a program to repeat the same yearly update without writing the instruction many times. First, set totalEmissions equal to initialTotal. Then repeat once for each year: totalEmissions = totalEmissions + annualRate. A counter variable can track the current year, and the program can display the total after every update. Suppose initialTotal is 100, annualRate is 10, and years is 3. The loop produces 110 after year 1, 120 after year 2, and 130 after year 3. This repeated process gives the same result as the function 100 + 10 × 3. The loop is especially useful when running many years or changing the rate according to a rule. Check that the loop runs exactly the intended number of times, because one extra repetition changes the answer.

Run Baseline and Reduction Scenarios
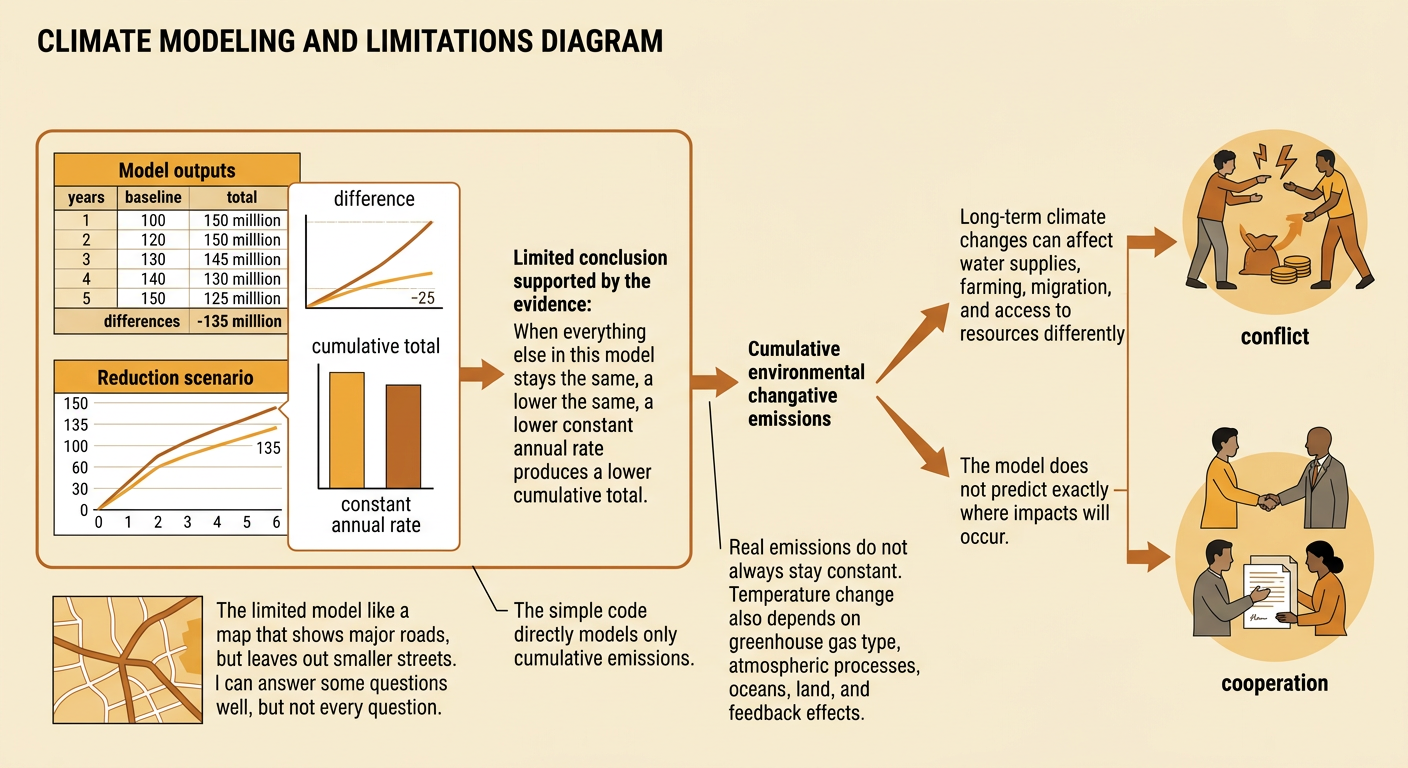
A scenario is a set of input values used to explore a possible outcome. Run a baseline scenario using an annualRate of 10 million metric tons per year. Then run a reduction scenario using 7 million metric tons per year. Keep initialTotal at 100 million metric tons and years at 5 so the comparison is fair. The baseline output is 100 + 10 × 5, or 150 million metric tons. The reduction output is 100 + 7 × 5, or 135 million metric tons. The difference is 15 million metric tons over five years. Ask what evidence would justify choosing a lower rate. For example, researchers might examine changes in fossil fuel use, transportation, electricity generation, or land use. The model compares possible emissions totals; it does not by itself prove how much global temperature will change.

Debug with Predicted Test Cases
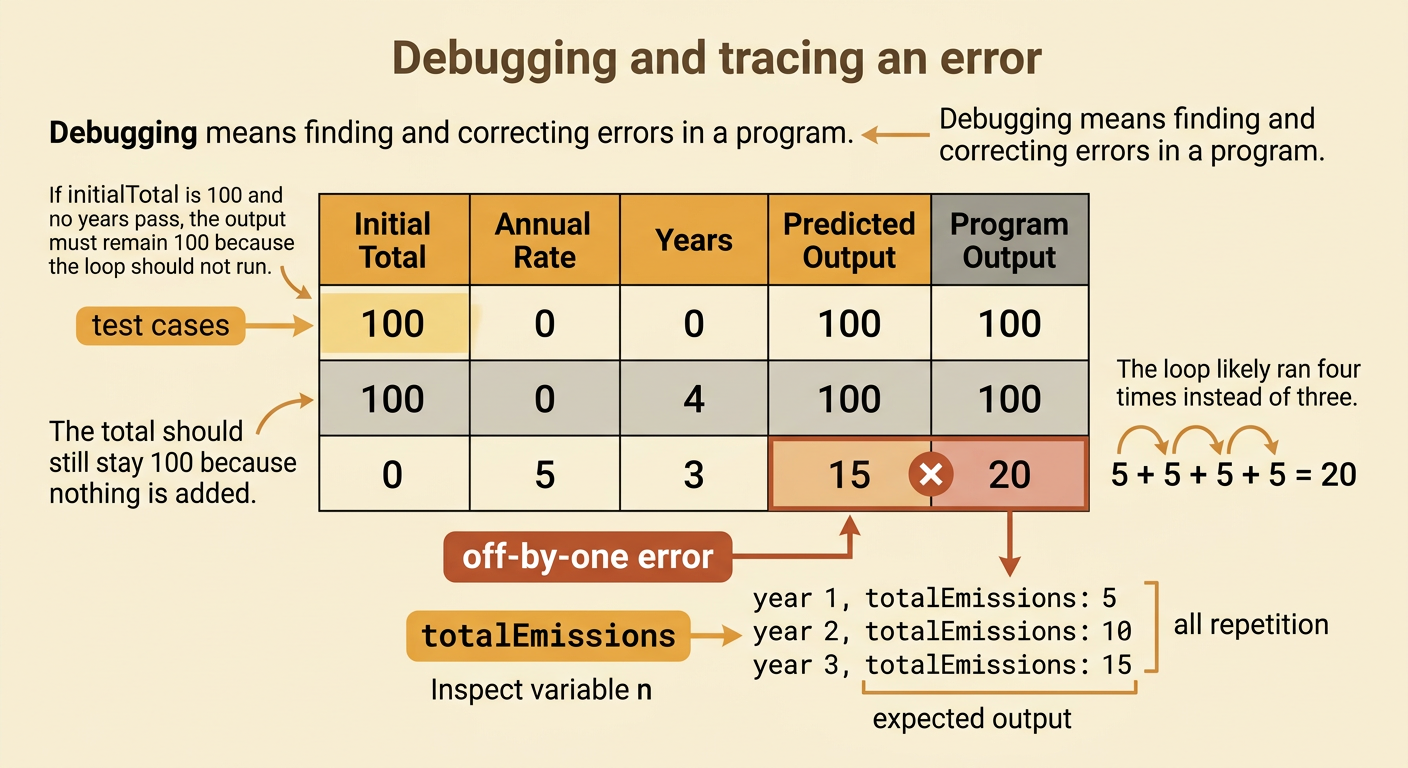
Debugging means finding and correcting errors in a program. Before running the model, create test cases with outputs that can be predicted by hand. One useful test sets years to 0. If initialTotal is 100, the output must remain 100 because the loop should not run. Another test sets annualRate to 0 for 4 years; the output should again stay 100. A third test uses initialTotal 0, annualRate 5, and years 3, so the expected output is 15. If the program reports 20, the loop may have run four times instead of three. This is an off-by-one error. Trace the values of year and totalEmissions after each repetition to locate the mistake. Also check variable names, update order, input units, and whether the total is accidentally reset inside the loop.
Compare Outputs and Explain Limitations
Compare scenario outputs using tables, graphs, and differences, but explain what the numbers do and do not show. In the five-year example, the baseline reaches 150 million metric tons and the reduction scenario reaches 135 million metric tons. This supports the limited conclusion that a lower constant annual rate produces a lower cumulative total. Real emissions are not always constant, and temperature change also depends on greenhouse gas type, atmospheric processes, oceans, land, and feedback effects. The model also does not predict where impacts will occur. Long-term climate changes can affect water supplies, farming, migration, and access to resources differently across regions. These patterns may contribute to conflict, but they can also encourage cooperation through agreements, shared technology, or resource planning. Treat model results as evidence for asking better questions, not as complete predictions of environmental or social outcomes.