Collision Forces: Newton’s Third Law and Safer Designs
Students use evidence from collision models to explain equal and opposite forces and evaluate how engineering features reduce injury risk.

Illustrations are auto-generated and may be placeholders. They can be refreshed to match the narration.
Predicting What Happens in a Collision
Before studying a collision, identify the objects, their masses, their speeds, and their directions of motion. Then predict how each object’s motion will change. For example, imagine a moving shopping cart striking an identical cart that is initially at rest. During contact, the first cart pushes the second cart forward, while the second cart pushes back on the first. The moving cart slows, and the resting cart begins to move. If one cart carries extra mass, its velocity will usually change less because the same size force produces less acceleration on a larger mass. A prediction should describe both objects, not only the object that appears to be hit. A collision model, such as two carts on a track, allows students to compare these predictions with observations and measured data.

Newton’s Third Law Force Pairs
Newton’s Third Law states that when one object exerts a force on a second object, the second object exerts an equal-size force in the opposite direction on the first. These two forces act at the same time but on different objects. In a collision between a small car and a large truck, the car pushes on the truck with the same force magnitude that the truck pushes on the car. The forces are equal even though the car may experience a much greater acceleration because it has less mass. The force pair does not cancel because the forces act on separate objects. To describe the pair clearly, name both forces: the force of the car on the truck and the force of the truck on the car. Force sensors attached to collision carts can provide evidence that the two readings match in size and point in opposite directions.

Analyzing Collision Force Data
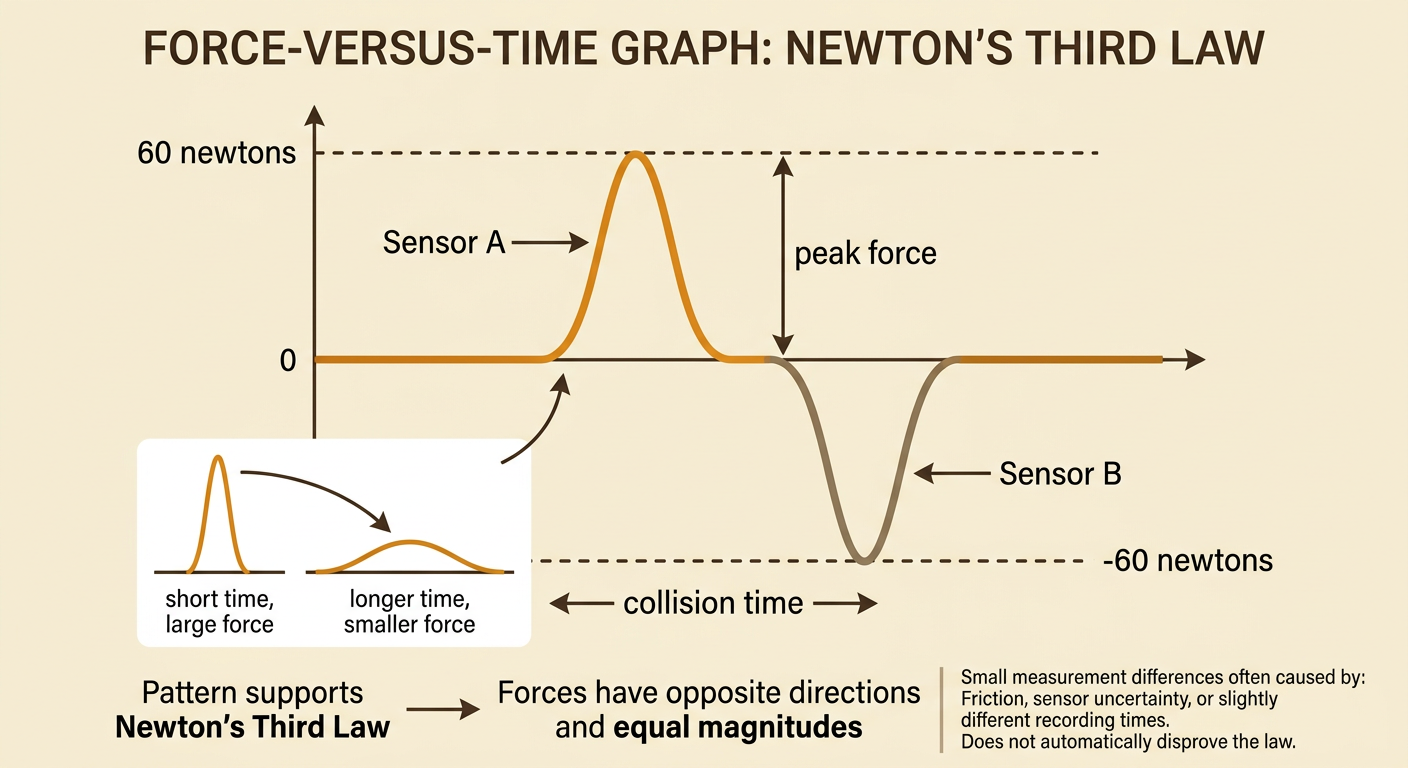
Force sensors can record force many times each second during a collision. Suppose Sensor A measures a peak force of 60 newtons to the right while Sensor B measures 60 newtons to the left at the same instant. The signs differ because the directions are opposite, but the magnitudes are equal, supporting Newton’s Third Law. A force-time graph also shows how long the collision lasts. A sharp peak means a large force acts for a short time, while a lower, wider curve means the change in motion occurs over a longer time. When comparing trials, students should cite specific values, units, times, and patterns rather than saying only that the graphs look similar. Small differences may result from sensor uncertainty, friction, or readings taken at slightly different times. The strongest conclusion considers whether the overall data pattern supports equal and opposite forces.
Designing a Safer Collision System
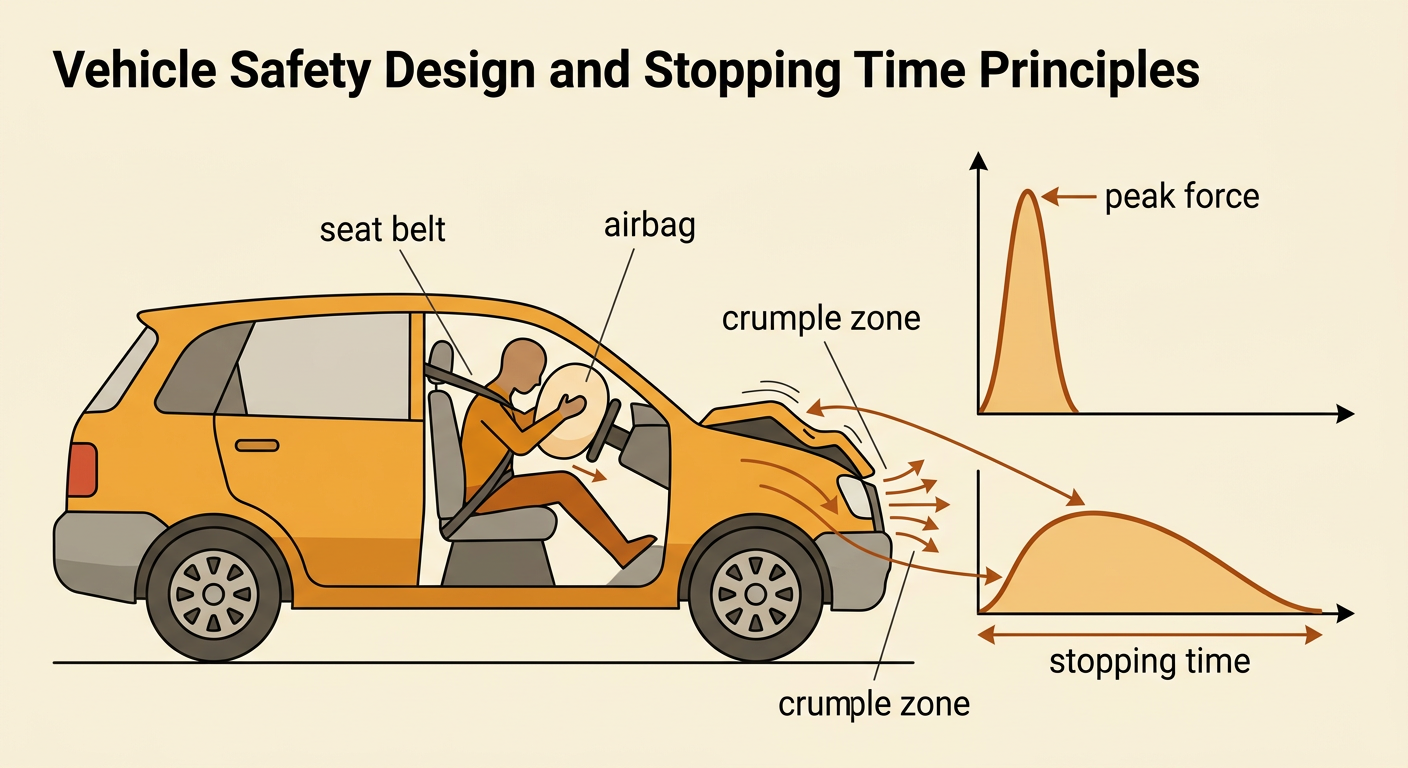
A safer design cannot eliminate the interaction force pair, but it can reduce the peak force on people by increasing the time over which their motion changes. For example, an airbag compresses as a passenger moves forward, lengthening the stopping time and spreading the force across a larger area of the body. Seat belts stretch slightly and keep passengers from striking hard surfaces. Vehicle crumple zones deform to absorb energy and extend the collision time. Students might design a cart that protects a model passenger using foam, a flexible barrier, and a secure restraint. They should test the cart under the same mass, speed, and track conditions in each trial. Useful criteria include a lower peak force and keeping the passenger inside the cart. Constraints may include cost, size, material limits, and visibility. Evidence from repeated tests should guide design improvements.
Connecting Evidence to Safety Policies
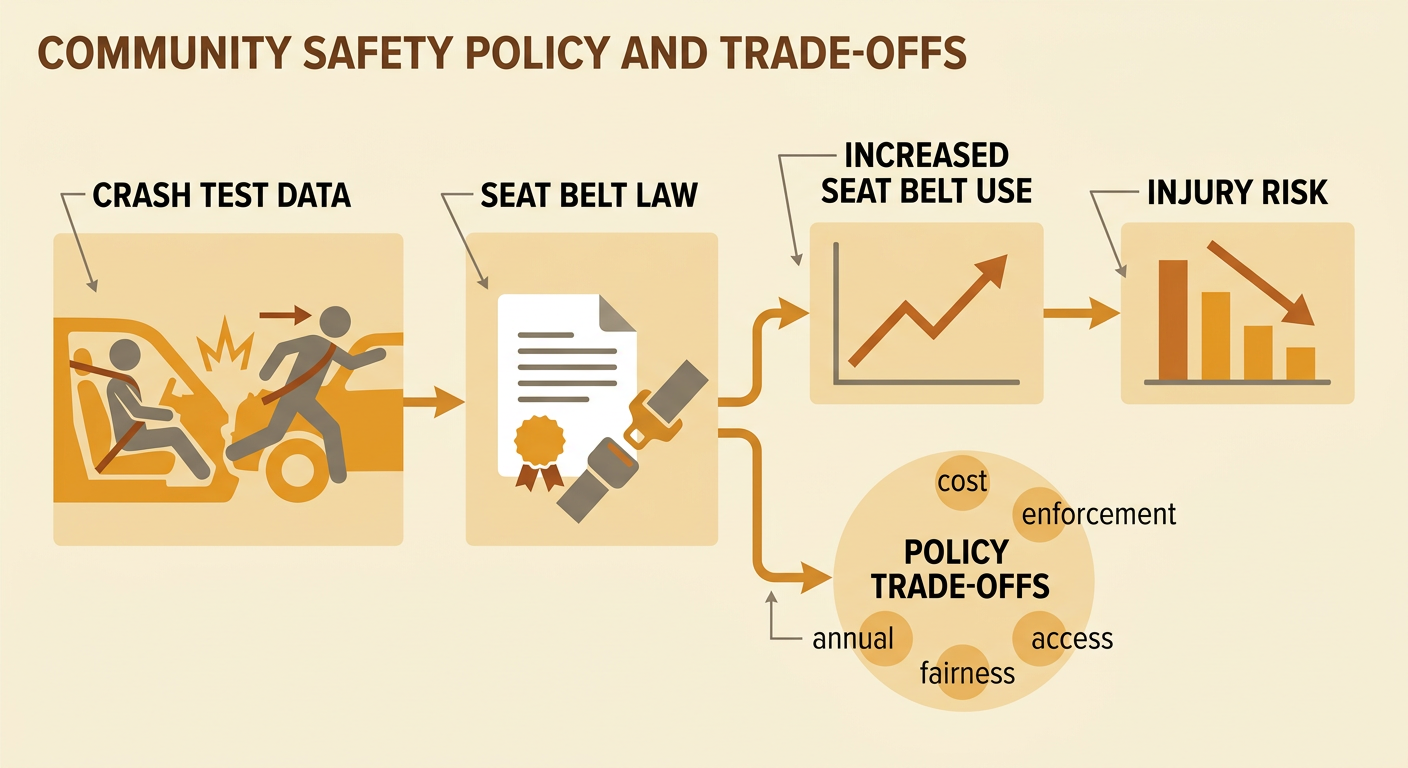
Public safety policies use scientific evidence to reduce injury risk across a community. Seat belt laws, child safety seat requirements, airbag standards, helmet rules, and vehicle crash tests encourage or require protective designs and behaviors. For example, collision evidence shows that a restrained passenger stops with the vehicle over a longer time instead of continuing forward into the dashboard. This supports policies requiring seat belt use. To evaluate a policy, students should identify its purpose, examine evidence about its effectiveness, and consider intended and unintended consequences. A helmet rule may reduce head injuries, but officials must also consider enforcement costs, access to properly fitted helmets, and whether penalties affect groups fairly. A strong policy claim cites specific scientific findings or data and explains how they support the rule. Policymakers can revise requirements when new collision evidence or improved technology becomes available.