
Collision Theory and Factors Affecting Reaction Rates
Students use collision theory and experimental evidence to explain how temperature and reactant concentration affect the rate of a chemical reaction.

Illustrations are auto-generated and may be placeholders. They can be refreshed to match the narration.
What Is Reaction Rate?
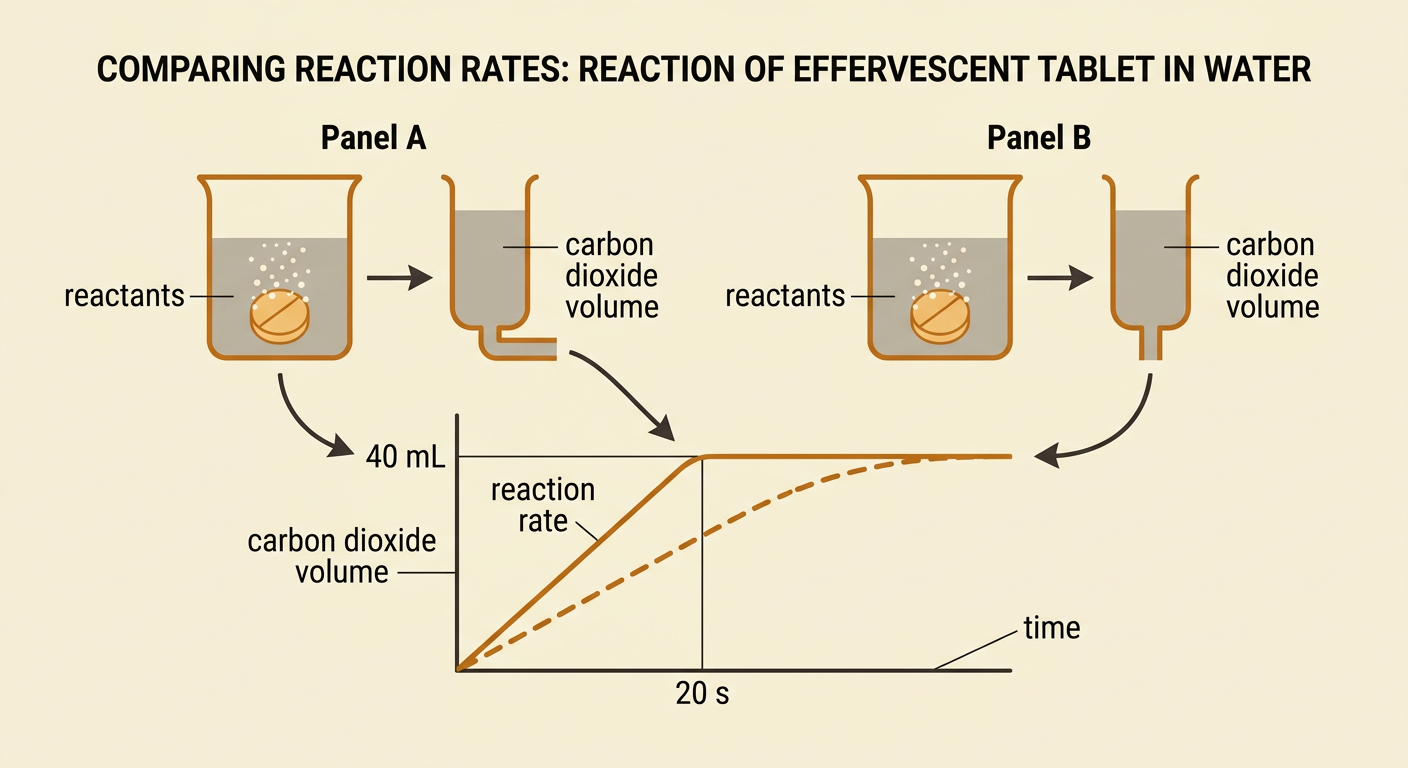
Reaction rate describes how quickly reactants are used up or products are formed during a chemical reaction. It can be measured as a change in concentration, mass, gas volume, color, or another observable property over time. A faster reaction produces the same amount of product in less time. For example, when an effervescent tablet reacts with water, carbon dioxide gas forms. Students can collect the gas and record its volume every 10 seconds. If 40 milliliters of gas forms in 20 seconds, the average rate is 2 milliliters per second. A graph of product amount versus time is steepest when the reaction is fastest. It becomes less steep as reactants are consumed. Reaction rate is not the same as the total amount of product; two reactions may produce equal amounts but take different lengths of time.
Particle Collisions and Activation Energy
Collision theory explains reactions by describing the motion and interactions of particles. Reactant particles must collide before their atoms can rearrange and form products. However, not every collision causes a reaction. A collision is effective only when the particles have enough energy and, for many reactions, the correct orientation. The minimum energy needed to begin a reaction is called activation energy. Imagine particles A and BC reacting to form AB and C. If A strikes the wrong side of BC, the needed bond may not form. If A approaches correctly but moves too slowly, the collision may still fail because its energy is below the activation-energy barrier. A properly oriented collision with enough energy can break an old bond while a new bond forms. Reaction rate depends on how often these effective collisions occur.

Temperature and Collision Frequency
Temperature measures the average kinetic energy of particles in a sample. When temperature increases, reactant particles move faster. Faster particles collide more often, but the most important effect is that a larger fraction of collisions have enough energy to overcome the activation-energy barrier. Therefore, the number of effective collisions per second increases, and the reaction rate rises. For example, an effervescent tablet usually reacts faster in warm water than in cold water when tablet size and water volume are kept constant. Students might observe that a tablet finishes reacting in 45 seconds at 40°C but requires 120 seconds at 10°C. This evidence supports a claim that higher temperature increases reaction rate. Temperature does not lower the activation energy by itself; it changes the particles’ kinetic-energy distribution and increases the fraction able to react.

Concentration and Reaction Rate
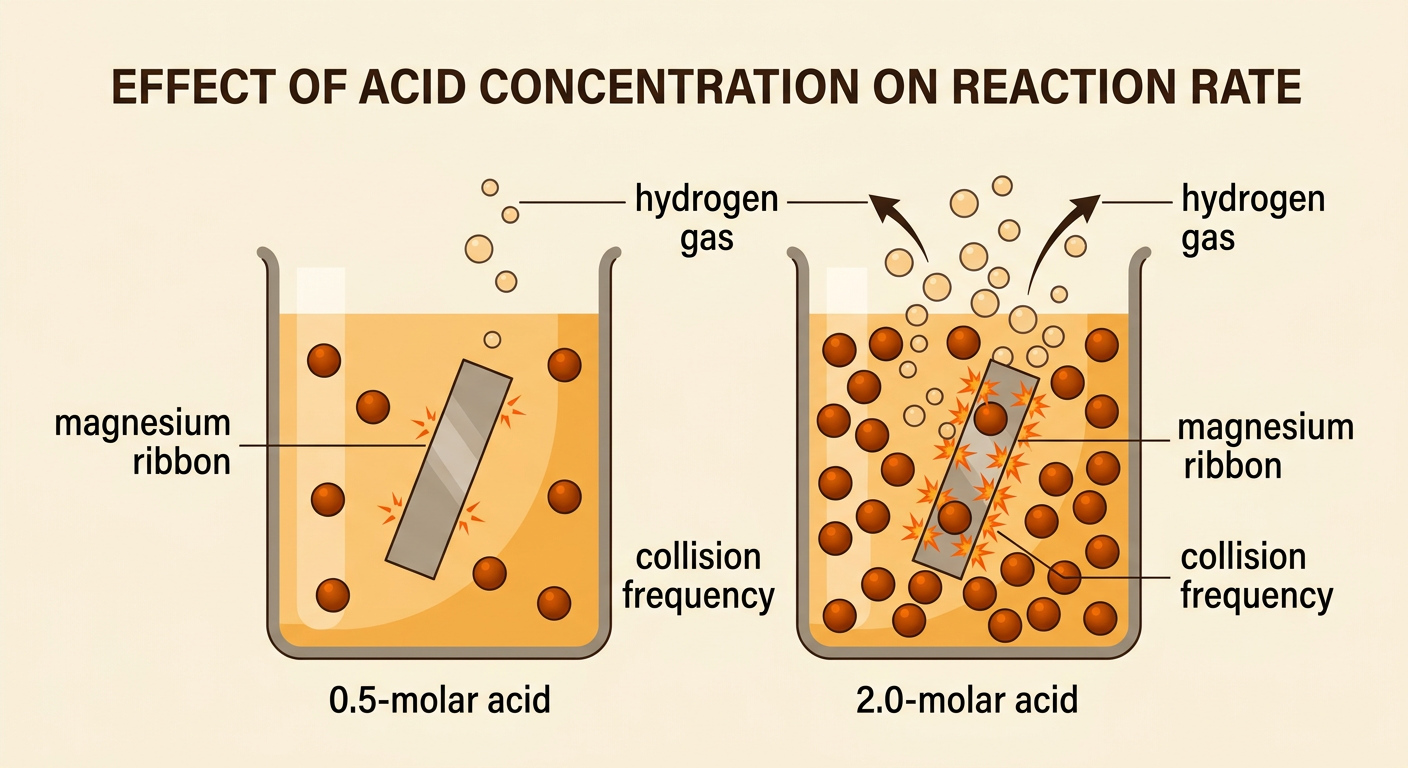
Concentration describes how much of a dissolved substance is present in a given volume of solution. A more concentrated solution contains more reactant particles in the same space. Because the particles are closer together, they collide more frequently. If temperature and other conditions remain constant, more collisions per second usually lead to more effective collisions and a faster reaction. For example, magnesium ribbon reacts with hydrochloric acid to produce hydrogen gas. A 2.0-molar acid solution generally produces hydrogen faster than a 0.5-molar solution when equal pieces of magnesium are used at the same temperature. Concentration changes collision frequency, but it does not give each particle more kinetic energy. A fair comparison must keep the magnesium size, acid volume, temperature, and measuring method constant. Only the acid concentration should be deliberately changed so it can be connected to differences in reaction rate.
Analyze Reaction-Rate Evidence
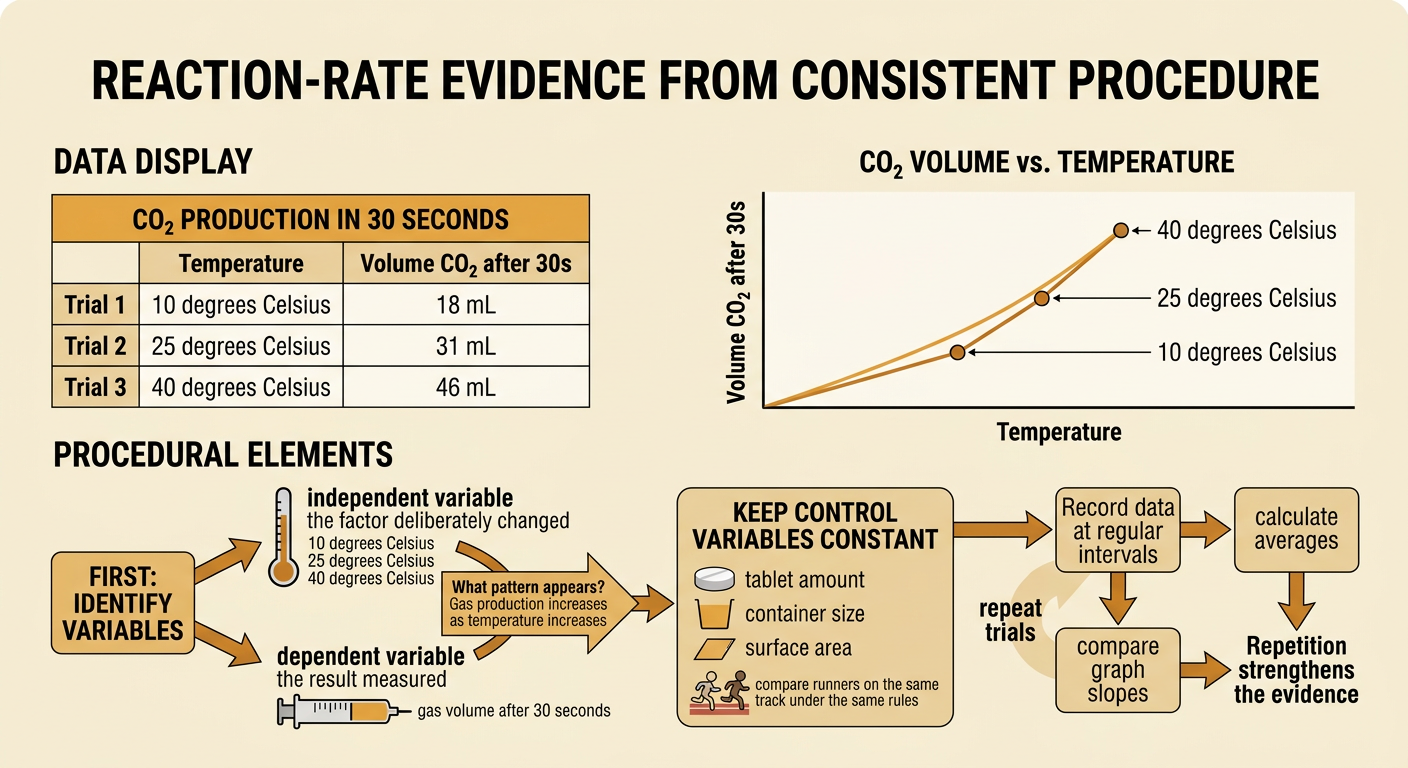
Reaction-rate evidence should be collected with a consistent multistep procedure. First, identify the independent variable, such as temperature, and the dependent variable, such as carbon dioxide volume after 30 seconds. Next, keep control variables constant, including reactant amounts, container size, and tablet surface area. Measure carefully at regular time intervals, record values in a table, and repeat each trial. Then calculate a rate or compare the slopes of product-versus-time graphs. Suppose tablet trials at 10°C, 25°C, and 40°C produce 18, 31, and 46 milliliters of gas in 30 seconds. The pattern shows that gas production increases with temperature. Repeated trials and averages make the evidence stronger. Possible limitations include heat loss, delayed timing, gas leaks, or unequal tablets. These limitations do not erase the pattern, but they may reduce confidence in the exact measured rates.
Write a Collision-Theory Explanation
A strong scientific explanation connects a precise claim, relevant evidence, and collision-theory reasoning. Begin with a claim such as, “Increasing temperature increases the reaction rate.” Support it with numerical evidence from a data table or graph, such as a rise from 18 to 46 milliliters of gas produced in 30 seconds. Then explain that higher temperature increases particle kinetic energy, causing faster motion and a larger fraction of collisions to exceed activation energy. For concentration, explain that more particles in the same volume cause more frequent collisions. Use evidence from multiple sources when available, including class trials, graphs, and reliable reference information. Also acknowledge limitations. For example, gas leakage could make every measured volume too low, although a repeated upward trend may still support the claim. Avoid stating only that particles “react more.” Name the changed particle behavior and show how it increases effective collisions per second.
