Comparing How Different Media Present Information
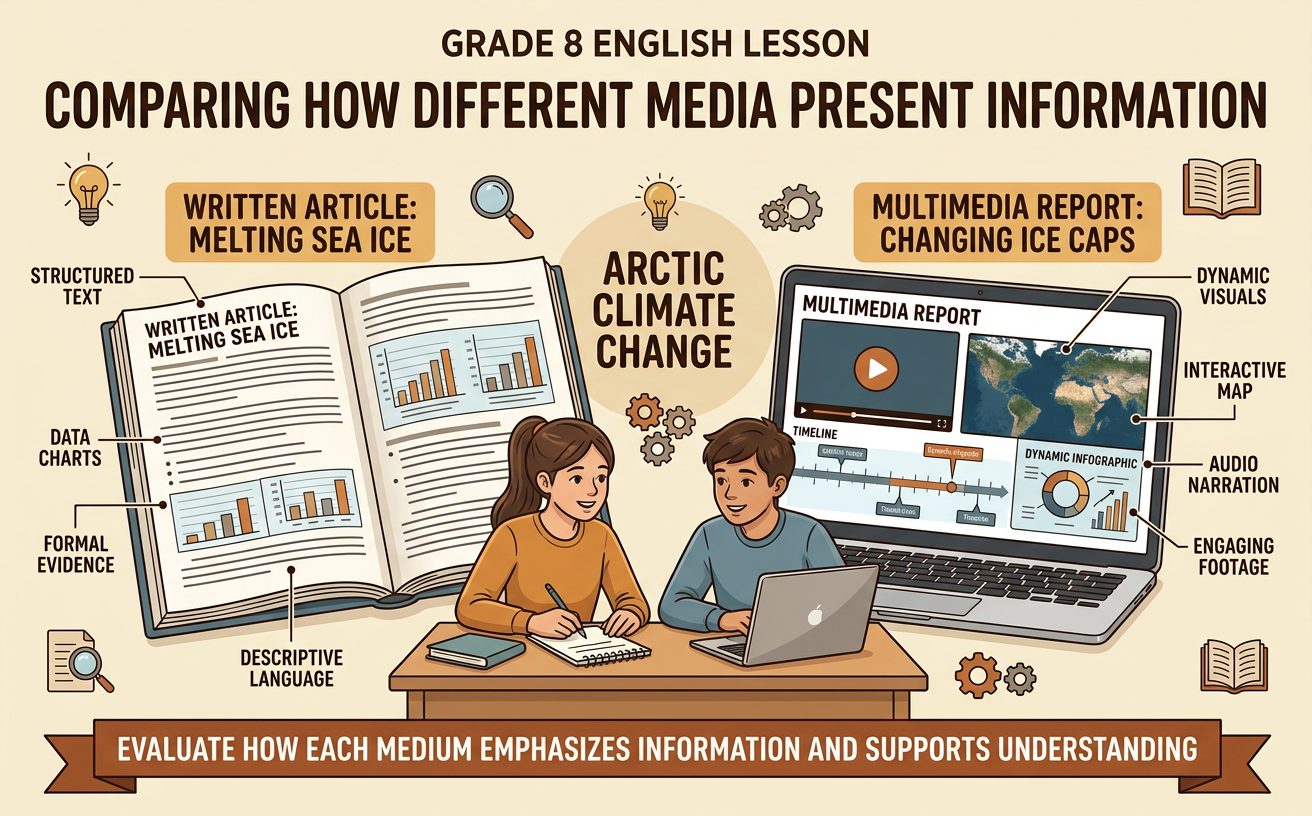
Students compare a written article with a visual or multimedia source to evaluate how each medium emphasizes information and supports understanding of a topic.
Illustrations are auto-generated and may be placeholders. They can be refreshed to match the narration.
Identify Each Medium’s Main Idea
Begin by identifying the main idea of each source separately. The main idea is the central point the creator wants the audience to understand. Look at the title, opening, repeated ideas, and conclusion of a written article. For a video or multimedia source, also notice narration, images, music, captions, and the amount of time given to each idea. Suppose an article explains that planting trees in cities improves health and reduces heat. A short video on the same topic may focus mainly on how neighborhood volunteers plant and care for trees. The sources share a topic, but their main ideas differ. State each main idea in one complete sentence without adding your opinion. This step creates a fair basis for comparing what each medium emphasizes and how it shapes the audience’s understanding.

Track Shared and Unique Details
After finding the main ideas, sort the supporting details into three groups: details found in both sources, details found only in the written source, and details found only in the visual or multimedia source. A Venn diagram or comparison chart can make these relationships clear. For example, both an article and a video might explain that tree shade lowers temperatures on city streets. The article might uniquely include a study showing that shaded areas can be cooler than nearby unshaded areas. The video might uniquely show a temperature reading changing as a presenter moves from sunlight into shade. Ask whether each detail is relevant, accurate, and connected to the source’s main idea. Tracking details helps reveal which information the creators selected, omitted, explained deeply, or made memorable through direct observation.

Analyze Visual and Audio Techniques
Visual and audio techniques can influence what viewers notice and how they respond. Examine camera angles, close-ups, charts, color, editing, sound effects, music, narration, and on-screen text. Then explain the effect of each choice instead of merely naming it. In a video about urban trees, a close-up of a child resting in the shade may emphasize personal comfort. An animated heat map using red for hotter blocks and green for cooler blocks may make temperature differences easy to recognize. Calm music and hopeful narration may create an optimistic mood about planting programs. However, these techniques can also guide emotions or oversimplify evidence. Compare them with print features such as photographs, headings, captions, maps, and data tables. Ask whether each technique clarifies information, adds emotional impact, establishes credibility, or distracts from the evidence.
Evaluate Strengths and Limitations
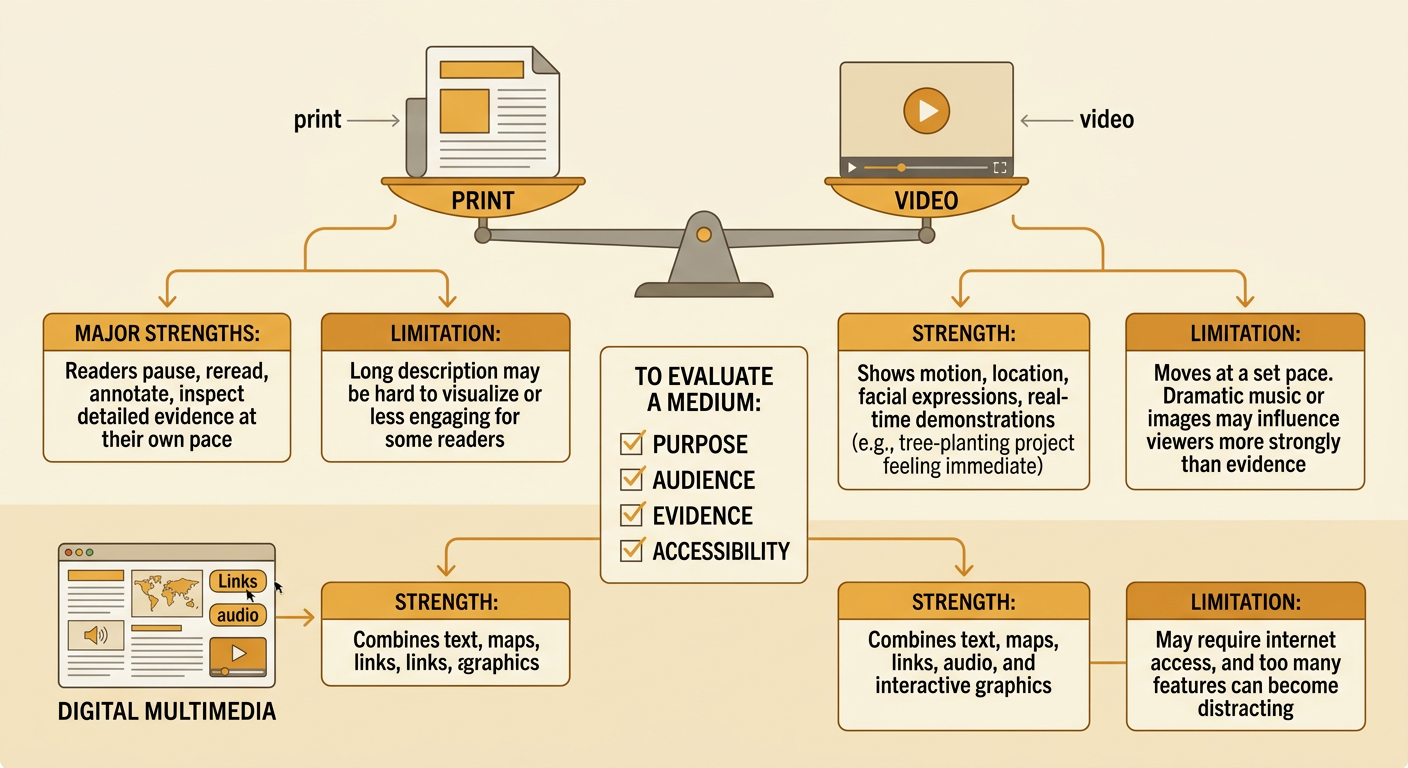
Evaluate each medium by considering what it does well and what it cannot do as effectively. Print often allows readers to pause, reread, annotate, and inspect detailed evidence at their own pace. However, a long article may be difficult to visualize or less engaging for some readers. Video can show motion, location, facial expressions, and real-time demonstrations. It may make an urban tree-planting project feel immediate and understandable. Yet video moves at a set pace, and music or dramatic images may influence viewers more strongly than the evidence does. Digital multimedia can combine text, maps, links, audio, and interactive graphics, but it may require internet access or distract users with too many features. Base your judgment on the purpose, audience, evidence, and accessibility of each source rather than simply choosing your favorite format.
Write a Comparative Conclusion
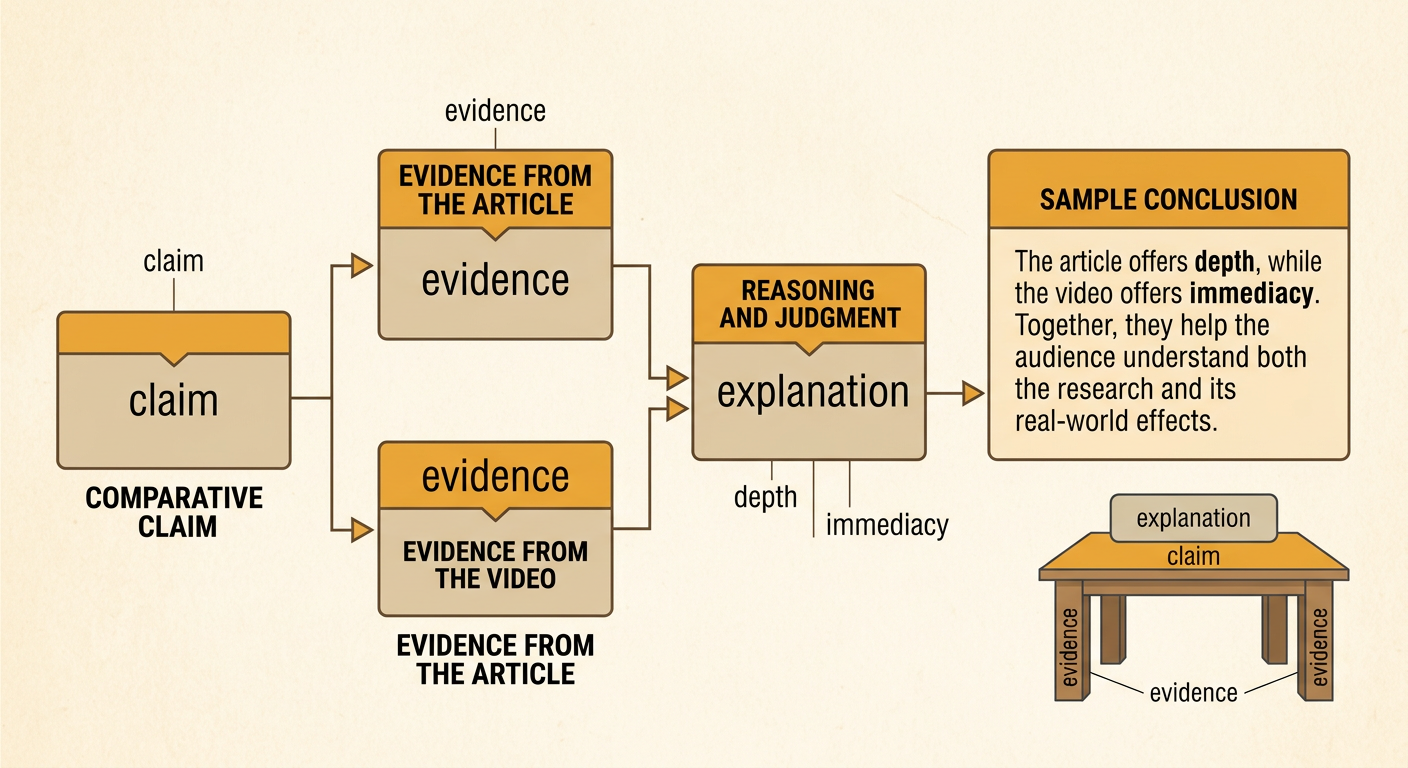
A comparative conclusion should make a clear judgment about how effectively the media present the topic. Begin with a claim that names both sources and states an important similarity or difference. Support the claim with specific evidence from each source. Then explain why the evidence matters for the audience’s understanding. For example: The article provides a stronger explanation of how urban trees reduce heat because it includes study results and detailed definitions, while the video makes the benefits easier to visualize through heat maps and neighborhood footage. Together, the sources offer both depth and immediacy. Avoid claiming that one medium is always better. Instead, connect your evaluation to the topic, purpose, and audience. End by explaining whether the sources complement each other or whether one leaves out information that readers or viewers need.