Comparing Linear and Exponential Growth
Students compare tables, graphs, and real-world situations to determine whether change is linear or exponential.
Illustrations are auto-generated and may be placeholders. They can be refreshed to match the narration.
Review Additive and Multiplicative Change
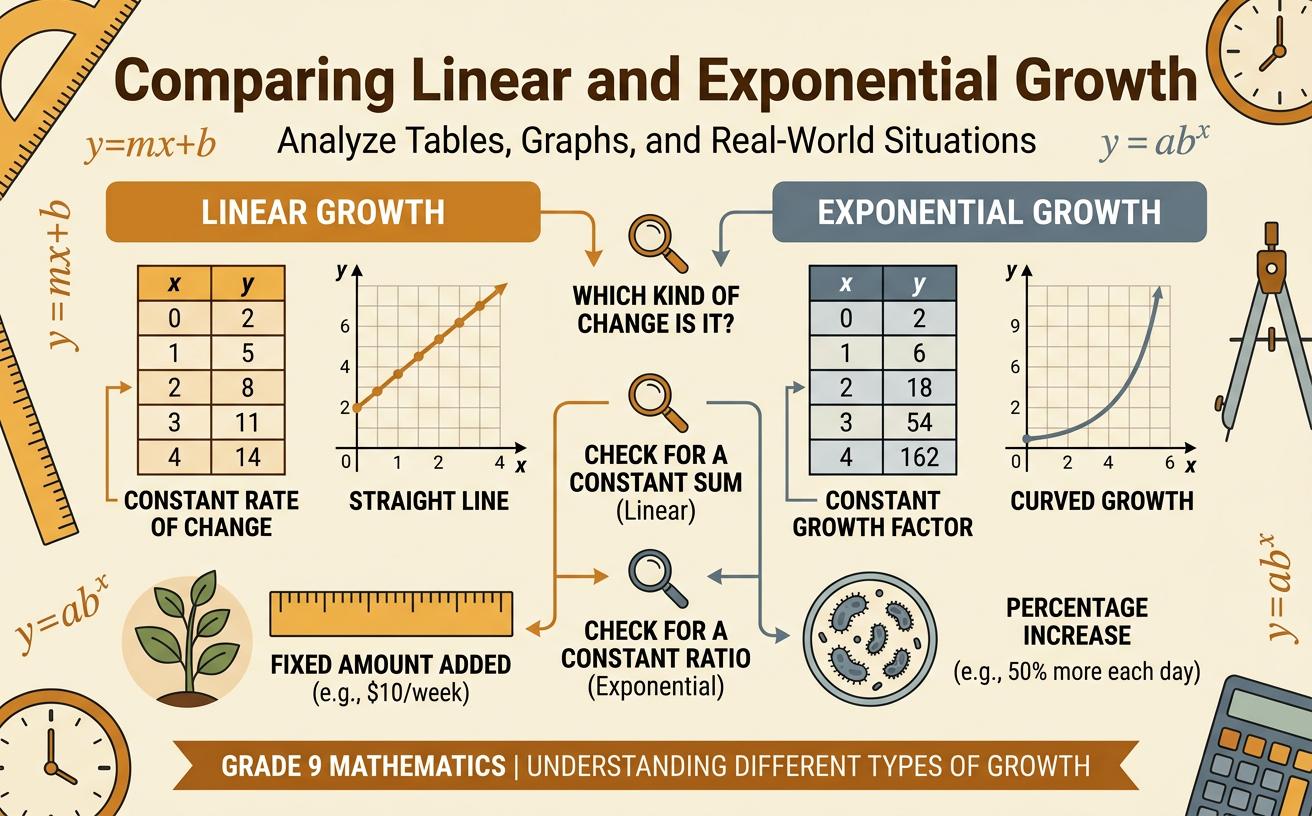
Linear growth occurs when a quantity increases by the same amount during each equal time interval. This is additive change. For example, suppose a plant is 10 centimeters tall and grows 3 centimeters each week. Its heights are 10, 13, 16, and 19 centimeters. The constant difference is 3 centimeters per week. Exponential growth occurs when a quantity is multiplied by the same factor during each equal interval. This is multiplicative change. If a bacteria culture begins with 10 cells and doubles each hour, the counts are 10, 20, 40, and 80. The constant factor is 2. Both patterns grow, but they do so differently: linear growth adds equal amounts, while exponential growth uses equal factors or equal percent changes.

Identify Patterns in Tables
A table can reveal whether a pattern is linear or exponential. First, confirm that the input values increase by equal intervals. Then compare consecutive output values. If the differences are constant, the relationship is linear. In the table 5, 9, 13, 17, each output increases by 4, so the pattern is linear. If the ratios are constant, the relationship is exponential. In the table 5, 10, 20, 40, each output is divided by the previous output to give 2, so the pattern is exponential. Do not classify a pattern only because its values increase. Look for equal differences or equal ratios. A ratio is most useful when previous values are not zero. Differences describe the amount added, while ratios describe the factor used to multiply.

Compare Linear and Exponential Graphs
A linear function has a constant rate of change, so its graph is a straight line. For example, y = 2x + 1 increases by 2 units in y whenever x increases by 1. An exponential growth function has an increasing rate of change, so its graph curves upward. For example, y = 2 to the power of x has values 1, 2, 4, 8, and 16 for x-values 0 through 4. At first, an exponential graph may lie below a linear graph. However, repeated multiplication can eventually make exponential growth much faster. On equal-width intervals, a line has equal vertical changes. An exponential growth curve has increasingly large vertical changes. The curved shape alone is not enough evidence; connect the graph to constant ratios in values.

Classify Real-World Situations
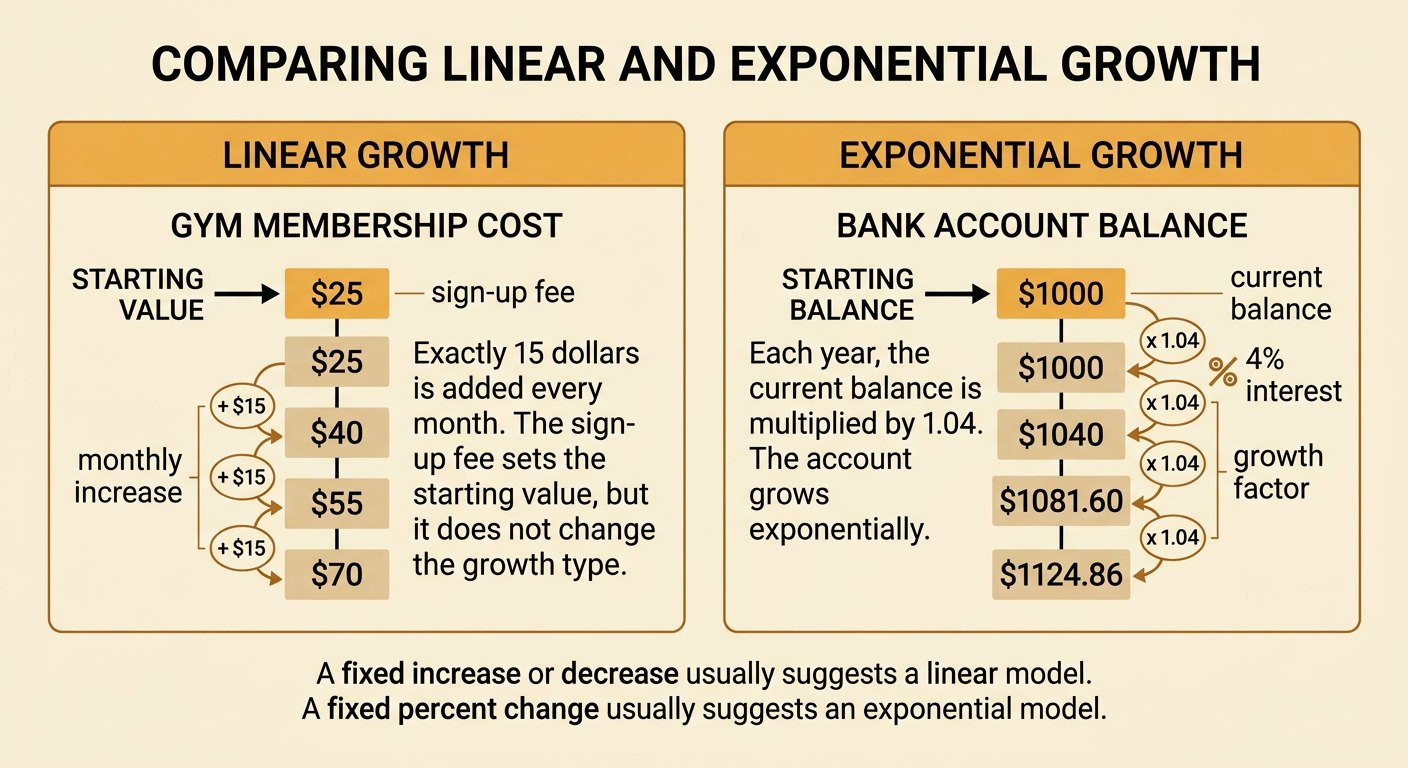
To classify a real-world situation, identify how the quantity changes during equal time intervals. A gym charges a $25 sign-up fee plus $15 each month. The total cost grows linearly because the same $15 is added monthly. A bank account earning 4% interest per year, with interest added to the balance, grows exponentially because the balance is multiplied by 1.04 each year. Percent change usually suggests an exponential model when the percent is repeatedly applied to the current amount. A fixed increase or decrease usually suggests a linear model. Context matters: earning $4 each year is additive, but earning 4% each year is multiplicative. Other exponential situations include populations growing by a fixed percent and values decreasing by the same percent over equal intervals.
Explain the Model Choice
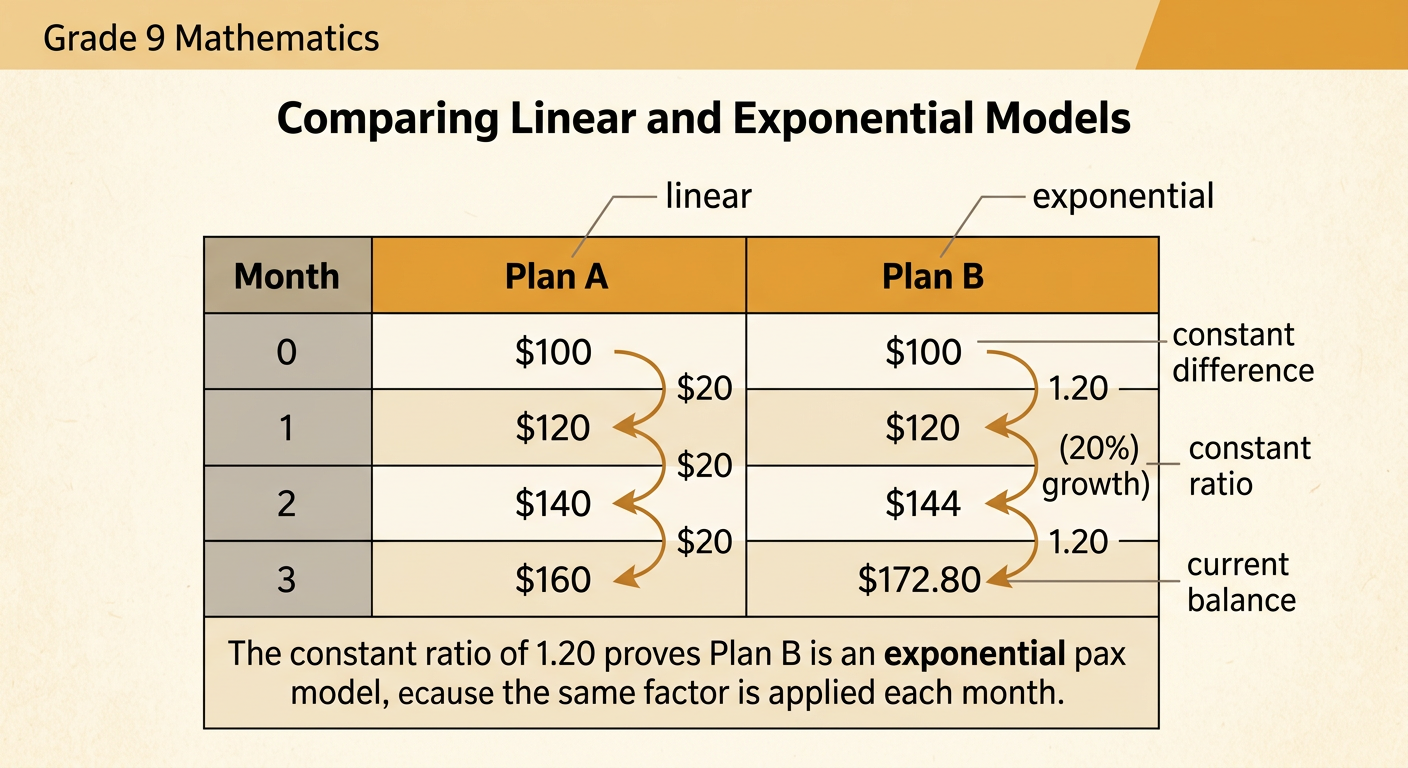
A strong model choice includes evidence, not just a label. State what changes, identify the equal interval, and describe whether the pattern has a constant difference or a constant ratio. Suppose Plan A starts with $100 and receives an additional $20 each month. Its balances are $100, $120, $140, and $160, so the constant difference of $20 supports a linear model. Plan B starts with $100 and grows by 20% each month. Its balances are $100, $120, $144, and $172.80, so the constant ratio of 1.20 supports an exponential model. Although both plans gain $20 in the first month, their later changes differ. When explaining, connect the operation to the context: Plan A repeatedly adds money, while Plan B repeatedly multiplies the current balance.