Comparing Linear Functions in Multiple Representations
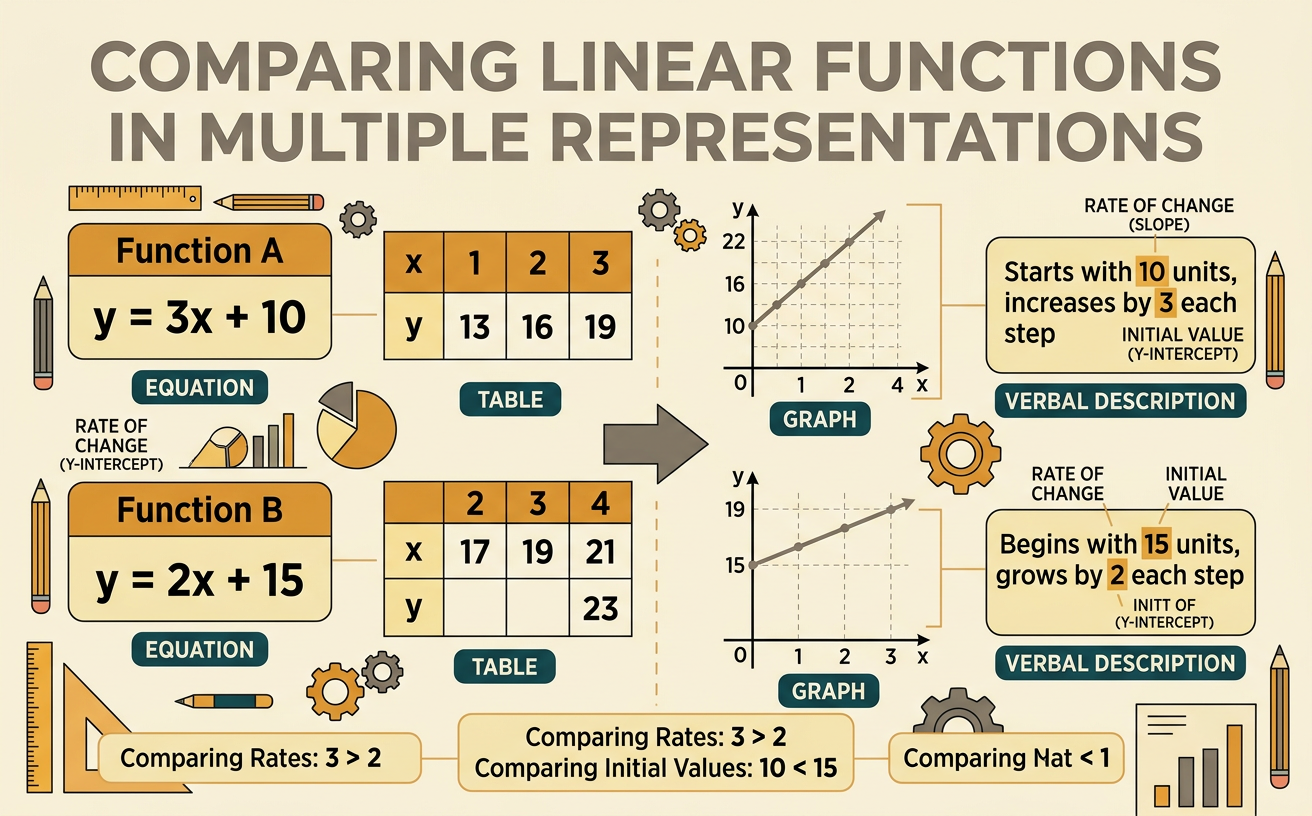
Students compare rates of change and initial values of linear functions represented by equations, tables, graphs, and verbal descriptions.
Illustrations are auto-generated and may be placeholders. They can be refreshed to match the narration.
Review Function Representations
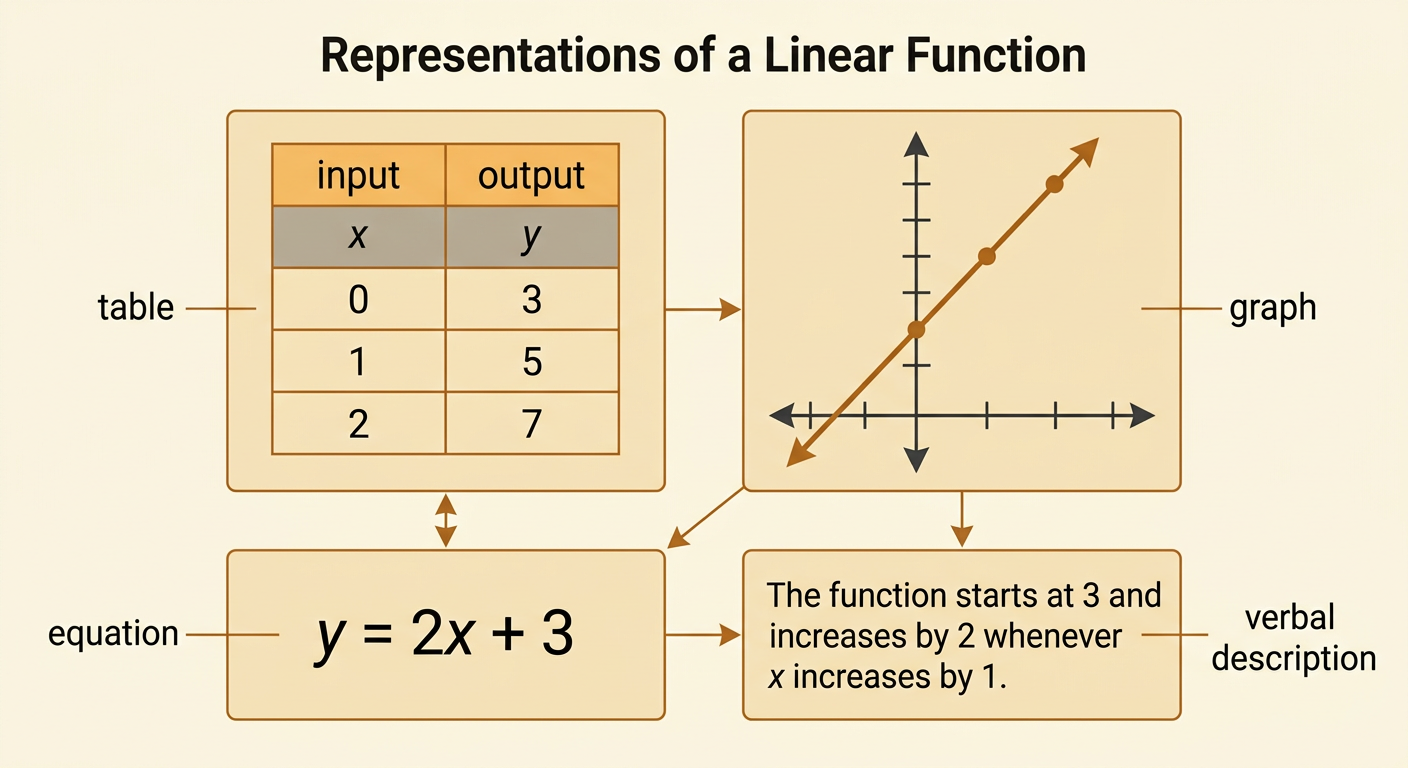
A function pairs each input with exactly one output. A linear function can be represented by an equation, a table, a graph, or a verbal description. For example, the equation y = 2x + 3 gives the same function as a table containing the points (0, 3), (1, 5), and (2, 7). Its graph is a straight line through those points. In words, the function starts at 3 and increases by 2 for every increase of 1 in x. These representations may look different, but they describe the same input-output relationship. To connect them, substitute table inputs into the equation, locate the resulting ordered pairs on the graph, and check that the verbal rule describes the same pattern.
Identify Rate of Change
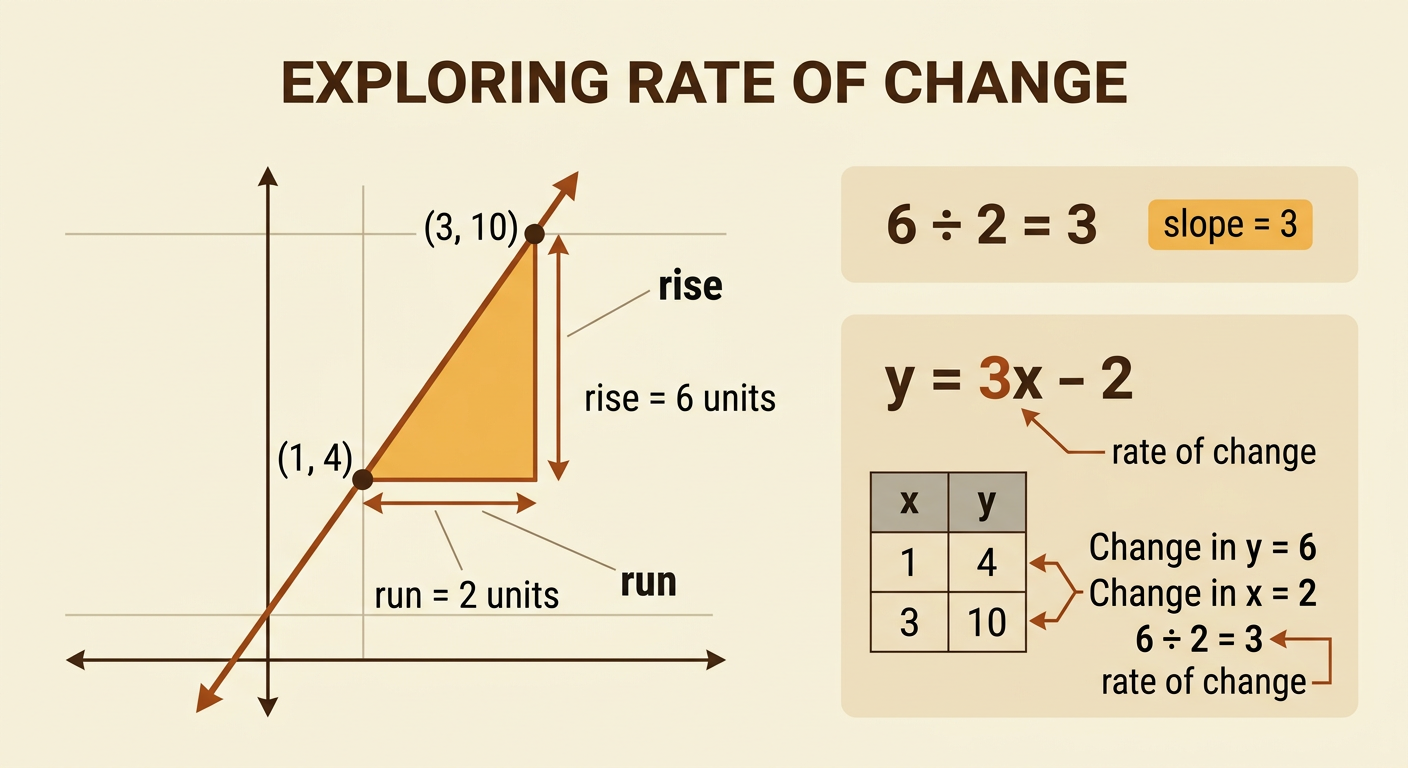
The rate of change tells how much the output changes when the input increases by 1. For a linear function, this rate is constant and is also called the slope. In an equation written as y = mx + b, the coefficient m is the rate of change. For example, in y = 3x - 2, the rate is 3. In a table, subtract two output values and divide by the difference between their input values. If the points are (1, 4) and (3, 10), the output changes by 6 while the input changes by 2, so the rate is 6 divided by 2, or 3. On a graph, this same calculation is described as rise divided by run.
Find Initial Values
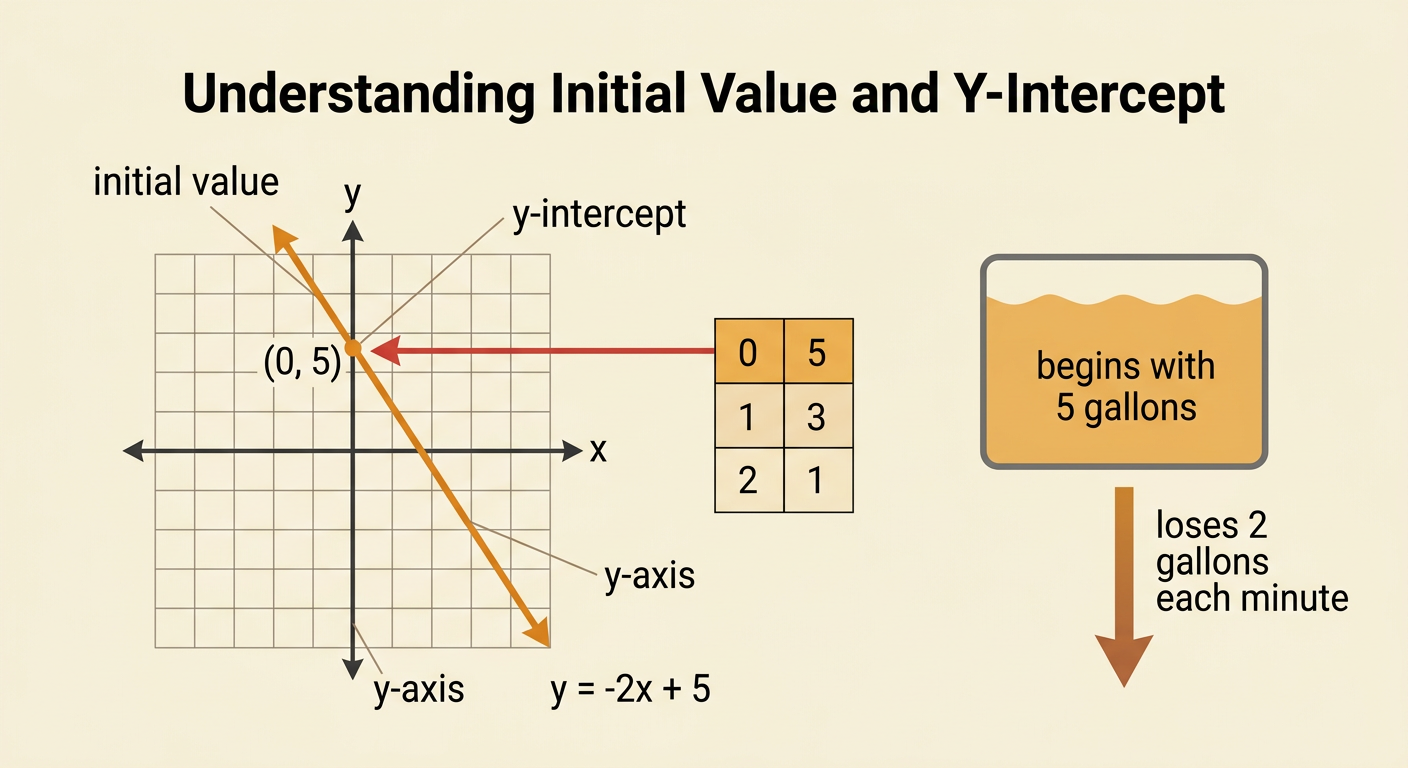
The initial value of a function is its output when the input is 0. In an equation written as y = mx + b, the constant b is the initial value. It is also the y-intercept because the graph crosses the y-axis where x = 0. For example, the function y = -2x + 5 has an initial value of 5. A table for this function includes the pair (0, 5), and its graph crosses the y-axis at 5. A verbal description might say, “A tank begins with 5 gallons and loses 2 gallons each minute.” The word “begins” signals the initial value. Always look for the output paired with an input of 0, even if you must extend a table backward to find it.
Compare Two Linear Functions
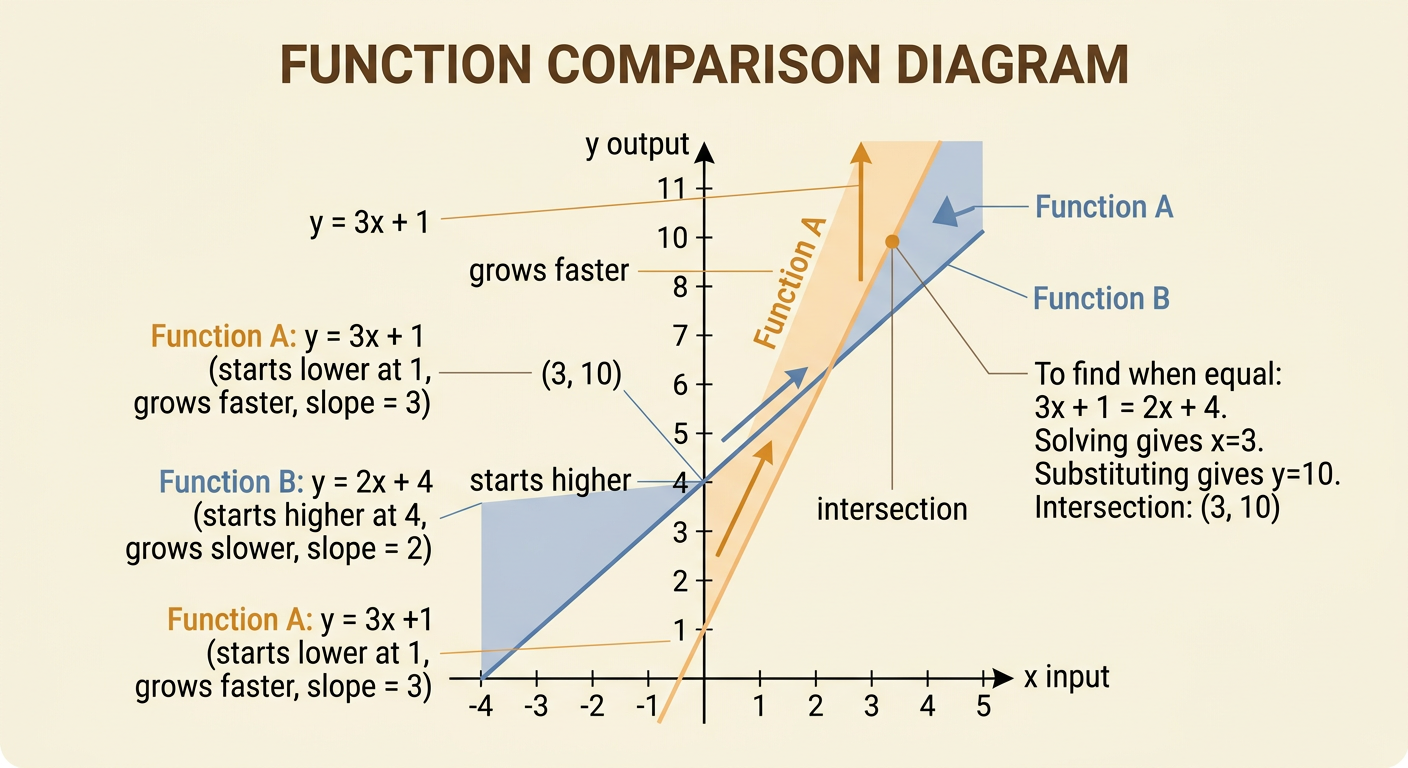
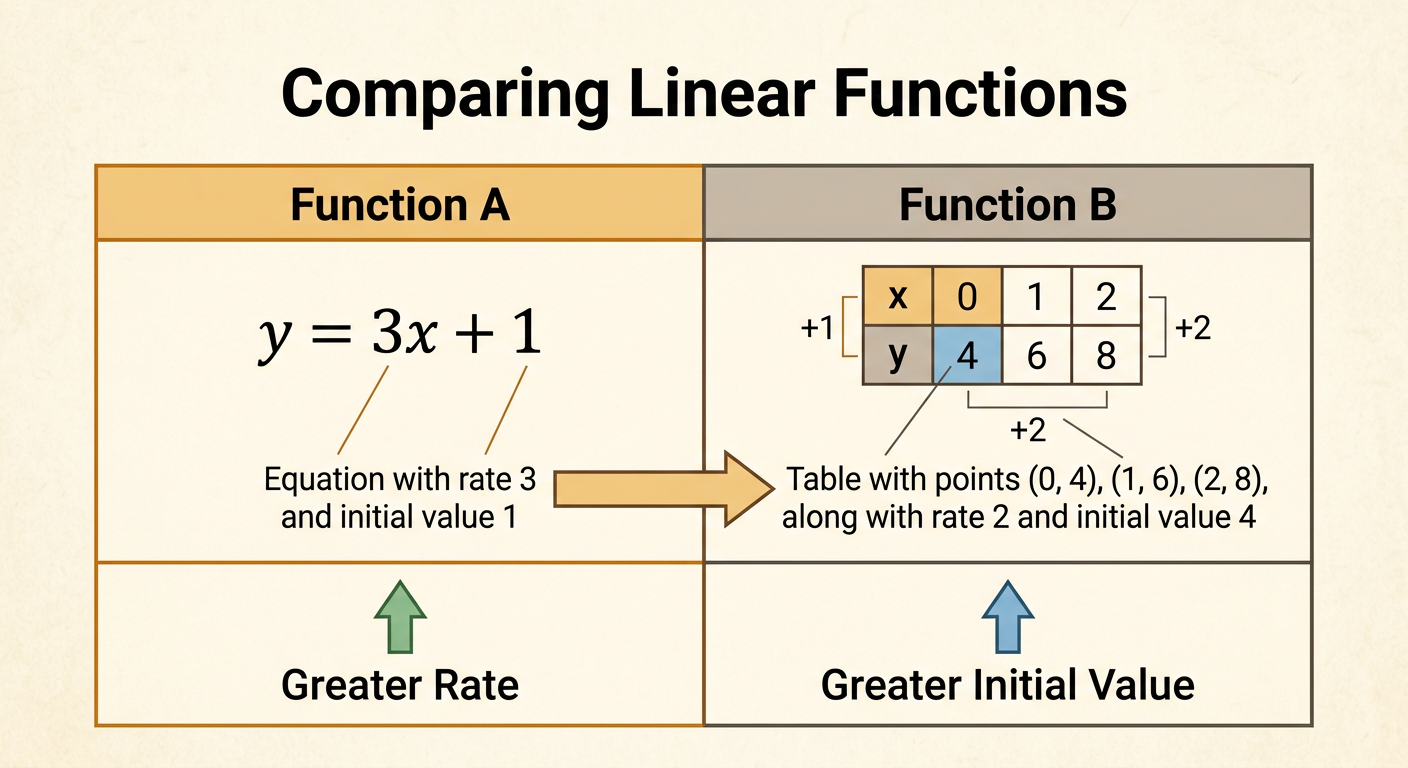
To compare two linear functions, identify the rate of change and initial value of each one, even when their representations differ. Function A is given by y = 3x + 1, so its rate is 3 and its initial value is 1. Function B is shown in a table with the points (0, 4), (1, 6), and (2, 8). Its outputs increase by 2 when its inputs increase by 1, so its rate is 2. The table also shows that its initial value is 4. Therefore, Function A has the greater rate of change, but Function B has the greater initial value. This means Function B starts higher, while Function A grows faster as x increases.
Explain the Comparison
A strong comparison names the property, gives evidence from each representation, and states what the difference means. For example, say, “Function A has a greater rate of change because its equation y = 3x + 1 shows a slope of 3, while Function B’s table increases by 2 output units for each 1 input unit.” You can also explain how the initial values affect the functions: Function B starts at 4, while Function A starts at 1. Starting higher does not mean a function will always have the greater output. These functions are equal when 3x + 1 = 2x + 4, which occurs at x = 3 and y = 10. Before x = 3, Function B is greater; after x = 3, Function A is greater.