Correlation Does Not Imply Causation
Students analyze relationships between two variables and use study context, confounding variables, and study design to distinguish correlation from causation.
Illustrations are auto-generated and may be placeholders. They can be refreshed to match the narration.
Reviewing Correlation
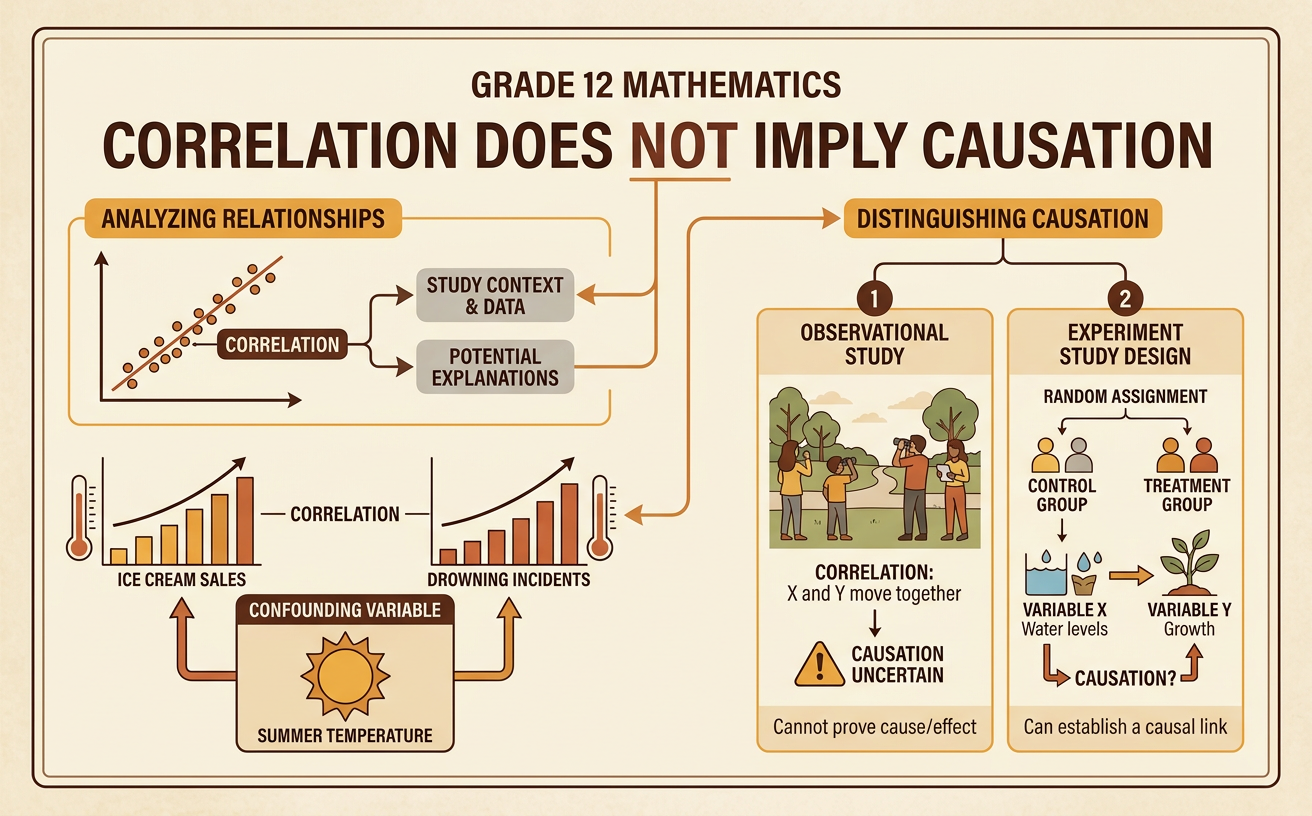
Correlation describes the direction and strength of a linear relationship between two quantitative variables. A correlation coefficient, r, ranges from −1 to 1. Values near 1 indicate a strong positive linear relationship, values near −1 indicate a strong negative linear relationship, and values near 0 indicate little linear relationship. For example, a survey of adults might find r = −0.72 between weekly exercise time and resting heart rate. The scatterplot would show that adults who exercise more tend to have lower resting heart rates. However, this pattern alone does not prove that exercise caused the difference. Age, diet, health status, or other variables may also be related to both measurements. Correlation summarizes a pattern in data; it does not explain why the pattern exists.

Recognizing Causal Claims
A causal claim states that changing one variable produces a change in another variable. Words such as causes, leads to, increases, reduces, and results in usually signal causation. In contrast, phrases such as is associated with, is related to, and predicts describe relationships without claiming cause. Suppose data show that ice cream sales and drowning incidents both rise during summer months. It would be incorrect to conclude that buying ice cream causes drowning. Hot weather increases swimming activity and also increases demand for ice cream, creating a positive correlation between the two measured variables. When evaluating a claim, identify its exact wording and ask whether the evidence supports only an association or an actual cause-and-effect relationship. Strong correlation, even when it is statistically significant, is not by itself evidence of causation.

Identifying Confounding Variables
A confounding variable is an outside factor related to both the explanatory variable and the response variable. It can create, hide, or distort an observed relationship. Imagine an observational study finds that students who attend optional tutoring earn higher test scores. Tutoring may help, but student motivation could be a confounding variable. Highly motivated students may be more likely to attend tutoring and may also study longer on their own, which can raise their scores. Prior knowledge, course attendance, and access to learning resources could also affect the result. To identify possible confounders, ask what other factors differ between the groups and whether those factors could influence the outcome. Statistical adjustments may reduce measured confounding, but unmeasured variables can remain. Therefore, an observational association should usually be described cautiously rather than treated as proof of cause.

Considering Study Design
Study design determines how strongly researchers can support a causal conclusion. In an observational study, researchers measure variables without assigning treatments. Such studies can reveal associations, but differences between groups may be caused by confounding variables. In a randomized experiment, participants are randomly assigned to treatment groups, which tends to balance both known and unknown background factors. For example, researchers could randomly assign students either to use a new study app or to continue their usual study method, then compare later test scores. If the groups are treated similarly in every other way and the app group performs better, the experiment provides evidence that the app caused the improvement. A control group, adequate sample size, consistent procedures, and low dropout rates strengthen the conclusion. Some questions cannot be tested experimentally because assignment would be unethical or impractical.

Revising Unsupported Conclusions
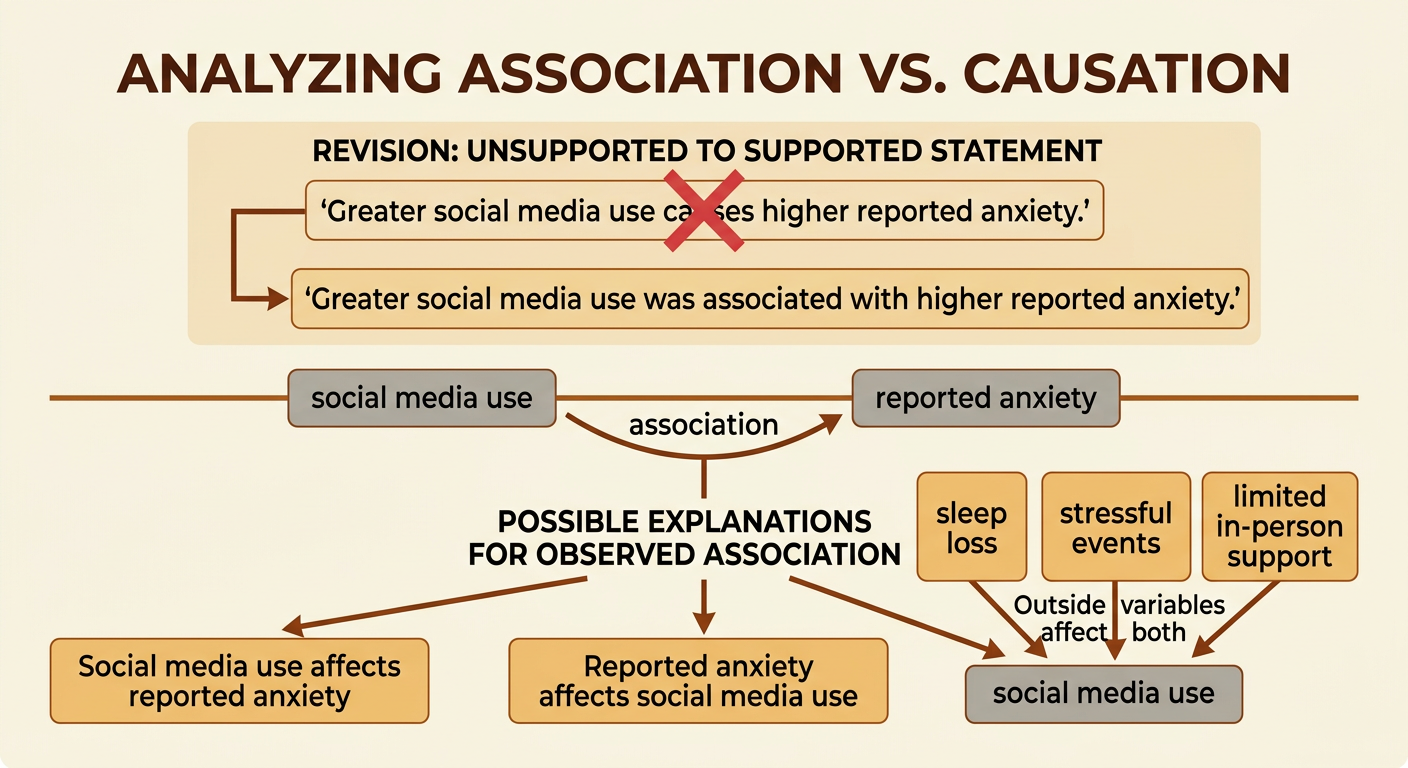
When evidence does not justify causation, revise the conclusion so that it accurately describes the observed association. Suppose a survey reports that teenagers who spend more time on social media also report greater anxiety. The statement “Social media use causes anxiety” is unsupported because the study is observational. Anxiety might lead some teenagers to use social media more, or factors such as sleep loss, stressful events, or limited in-person support might influence both variables. A defensible revision is: “In this sample, greater social media use was associated with higher reported anxiety.” This wording reports the pattern without claiming a cause. A strong conclusion should also identify the population studied, acknowledge important limitations, and avoid generalizing beyond the sample. To investigate causation, researchers would need a stronger design, evidence about time order, careful control of confounders, and results that are replicated across studies.