
Creature Genetics Challenge: Mix, Match, and Predict Traits
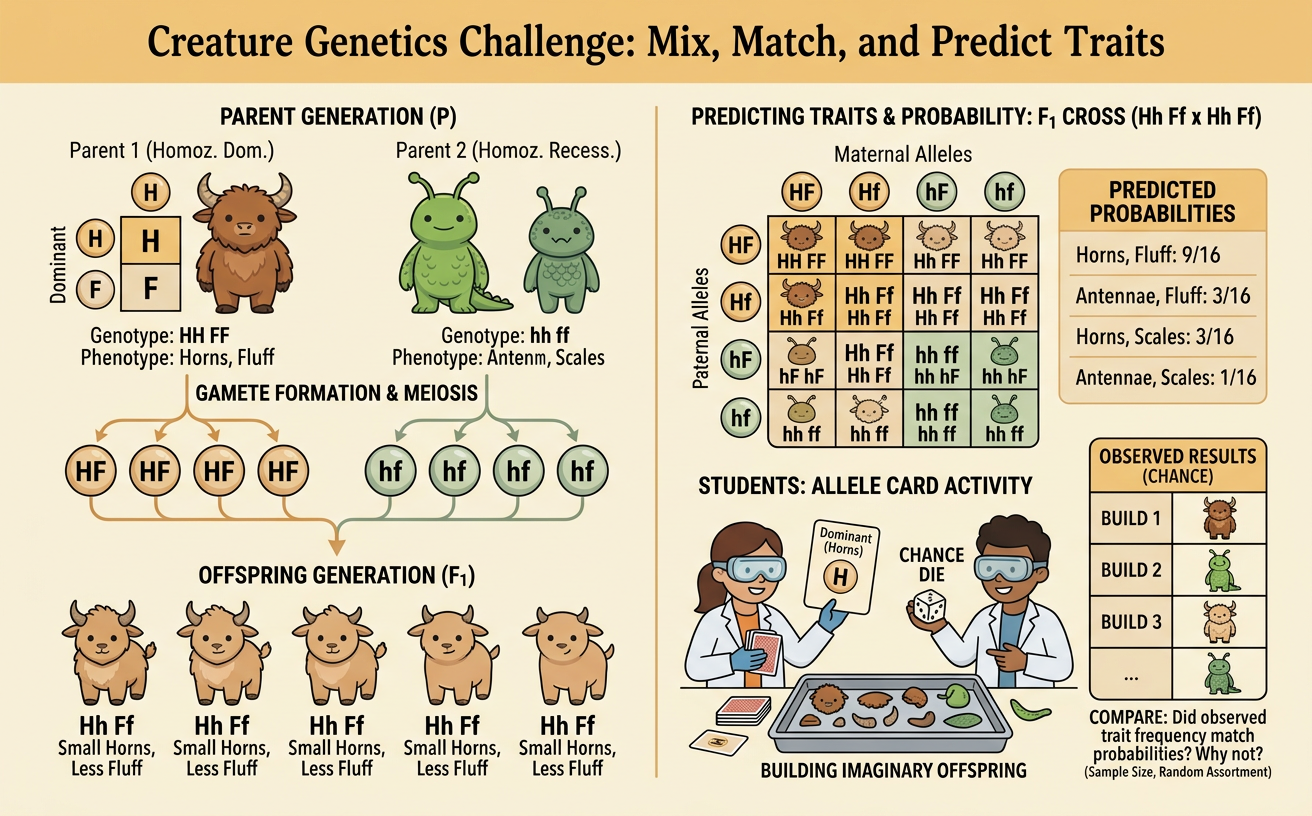
Students become genetics detectives by drawing allele cards, building imaginary offspring, and comparing predicted inheritance probabilities with the traits produced by chance.
Illustrations are auto-generated and may be placeholders. They can be refreshed to match the narration.
Mendel's Pea Plant Mystery
In the 1860s, Gregor Mendel investigated inheritance by carefully crossing pea plants with contrasting traits, such as purple or white flowers. He controlled which plants reproduced, counted many offspring, and repeated his crosses. When he crossed true-breeding purple-flowered plants with true-breeding white-flowered plants, the first-generation offspring had purple flowers. When those offspring reproduced, white flowers reappeared in about one-fourth of the next generation. Mendel concluded that offspring inherit separate factors from both parents rather than receiving a blended trait. These factors are now called genes. His controlled experiments, accurate records, and use of numerical patterns changed scientific understanding of inheritance. Mendel’s work shows how evidence from repeated observations can reveal a cause-and-effect relationship between reproduction and inherited traits.
Genes, Alleles, Genotypes, and Phenotypes
A gene is a section of DNA that helps influence a characteristic, such as pigment production. Different versions of a gene are called alleles. In a simplified creature model, the allele B produces blue body color and the allele b produces yellow body color. An offspring receives one allele from each parent, so its genotype might be BB, Bb, or bb. The genotype is the allele combination. The phenotype is the observable trait produced by the genotype and, for some traits, environmental influences. If B is dominant, creatures with BB or Bb are blue. The recessive yellow phenotype appears only with bb. Dominant does not mean stronger, better, or more common. It only describes how one allele’s effect can mask another allele’s effect in a heterozygous genotype.
Build a Creature with Allele Cards
Model inheritance by making two allele cards for each parent and each gene. Suppose both parent creatures have genotype Bb for body color. Place one B card and one b card in Parent 1’s bag, then do the same for Parent 2. Without looking, draw one card from each bag. The two drawn alleles form the offspring’s genotype. A B card from Parent 1 and a b card from Parent 2 produce a Bb, blue offspring. Return the cards before creating another offspring so each draw begins with the same probabilities. Repeat the process for another gene, such as H for horns and h for no horns. Each offspring receives one allele per gene from each parent, so sexual reproduction can create different allele combinations among siblings.
Predict Traits with a Punnett Square
A Punnett square displays all equally likely allele combinations for one genetic cross. For two blue heterozygous parents, write Bb × Bb. Place Parent 1’s possible alleles, B and b, above the columns. Place Parent 2’s possible alleles, B and b, beside the rows. Combine the row and column alleles in each box. The four results are BB, Bb, Bb, and bb. Therefore, the predicted genotype probabilities are 25% BB, 50% Bb, and 25% bb. Because B is dominant, BB and Bb creatures are blue. The predicted phenotype probabilities are 75% blue and 25% yellow. These values describe the chance for each offspring, not a promise that every group of four offspring will contain exactly three blue creatures and one yellow creature.
Compare Probability with Results
Predicted probability comes from a model, while experimental probability comes from actual trials. For a Bb × Bb cross, the Punnett square predicts that 75% of offspring will be blue and 25% will be yellow. Imagine that 40 allele-card trials produce 31 blue creatures and 9 yellow creatures. The observed proportions are 31 ÷ 40, or 77.5% blue, and 9 ÷ 40, or 22.5% yellow. These results are close to the prediction but not identical because chance affects small samples. Another set of 40 trials may give different totals. As the number of fair, independent trials increases, the observed proportions generally tend to move closer to the predicted probabilities. A bar graph makes differences between predicted and observed results easy to compare.
Genetics Detective Exit Challenge
Solve this final case using words, numbers, and a visual model. Two spotted creatures are heterozygous for a fur-pattern gene, so their cross is Ss × Ss. The dominant S allele produces spots, while the recessive s allele produces plain fur. First, draw and complete a Punnett square. Then state the predicted probability of a plain offspring and explain which genotype produces it. Next, suppose 20 offspring include 16 spotted and 4 plain creatures. Calculate each observed proportion and compare the results with your prediction. Finally, explain why siblings from the same parents can differ and how Mendel’s experiments helped scientists understand this variation. A strong answer notes that each parent contributes one allele, random allele combinations vary, and repeated crosses allowed Mendel to identify consistent inheritance patterns.