Describing and Graphing Motion
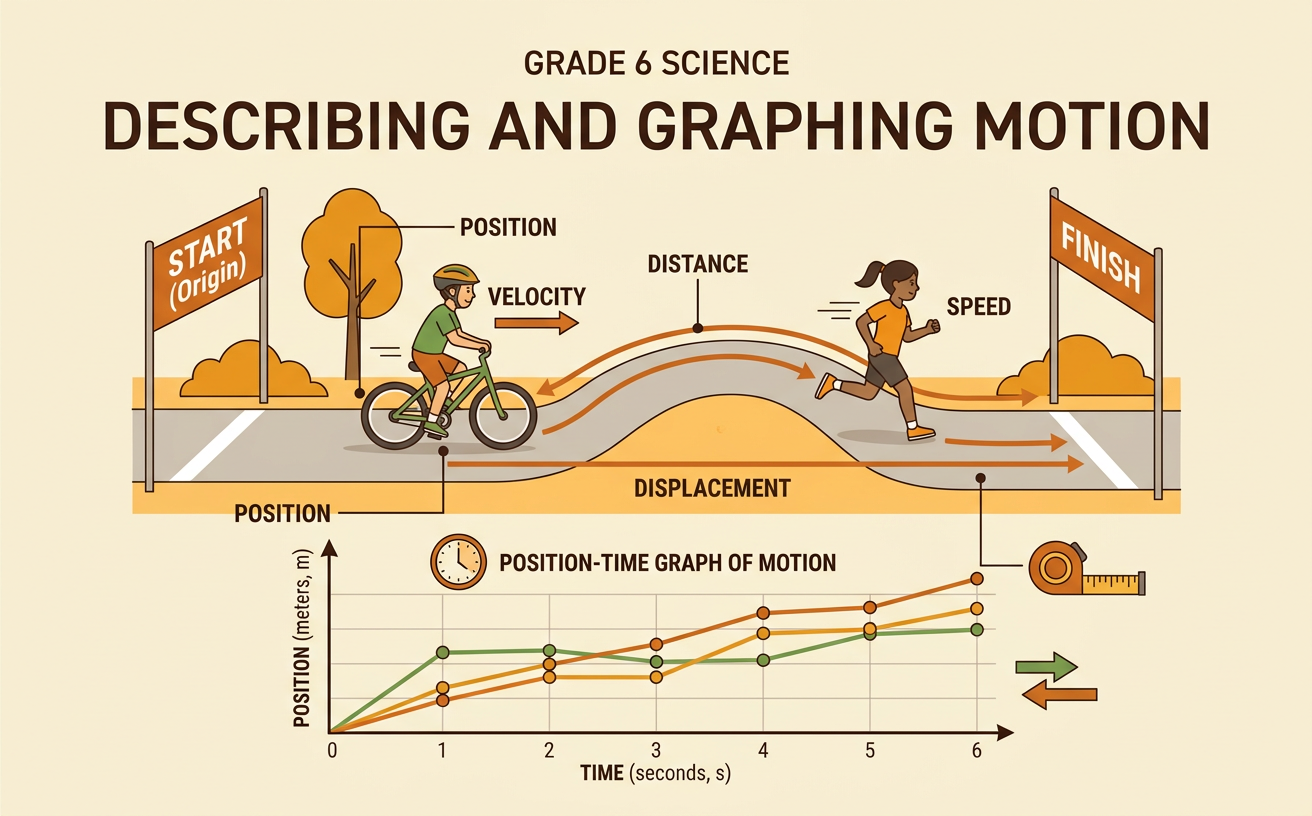
Students learn to describe an object's position, distance, displacement, speed, and velocity and use position-time graphs to represent motion.
Illustrations are auto-generated and may be placeholders. They can be refreshed to match the narration.
Position and Reference Points
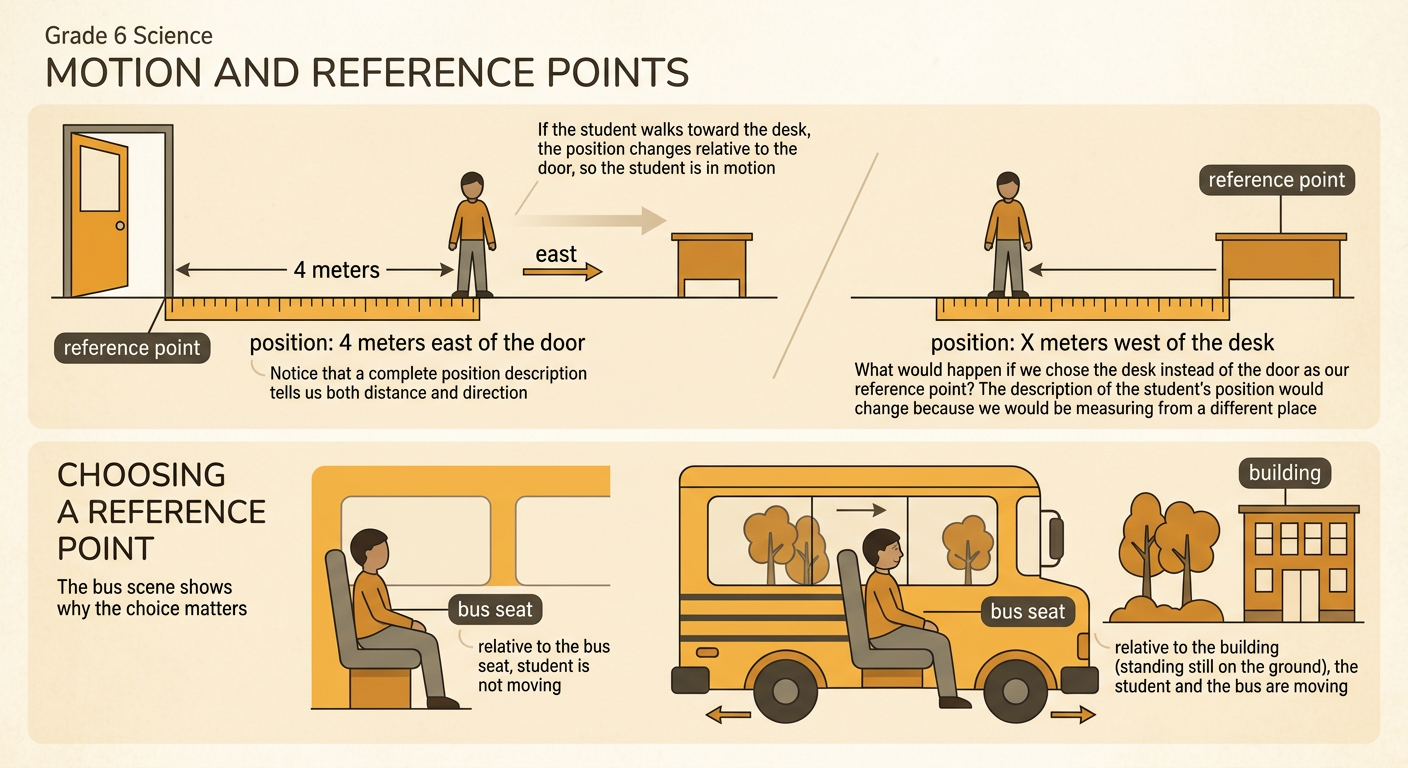
Motion is a change in position over time. To describe position, scientists choose a reference point, which is a location treated as staying still. Position also includes direction and distance from that reference point. For example, a student might be standing 4 meters east of the classroom door. The door is the reference point, 4 meters is the distance, and east is the direction. If the student walks toward a desk, the student's position changes relative to the door. Different reference points can produce different descriptions of the same motion. A passenger sitting on a moving bus is not moving relative to the seat but is moving relative to a building beside the road.
Distance and Displacement
Distance is the total length of the path an object travels. Displacement describes the straight-line change from an object's starting position to its ending position, including direction. Imagine that a student walks 5 meters east and then 2 meters west. The total distance is 7 meters because both parts of the trip count. The displacement is 3 meters east because the student finishes 3 meters east of the starting point. Distance can never be negative, but displacement depends on direction. If an object returns to its starting point, its displacement is zero even though it traveled some distance. These measurements help scientists compare the path taken with the overall change in position.
Speed and Velocity
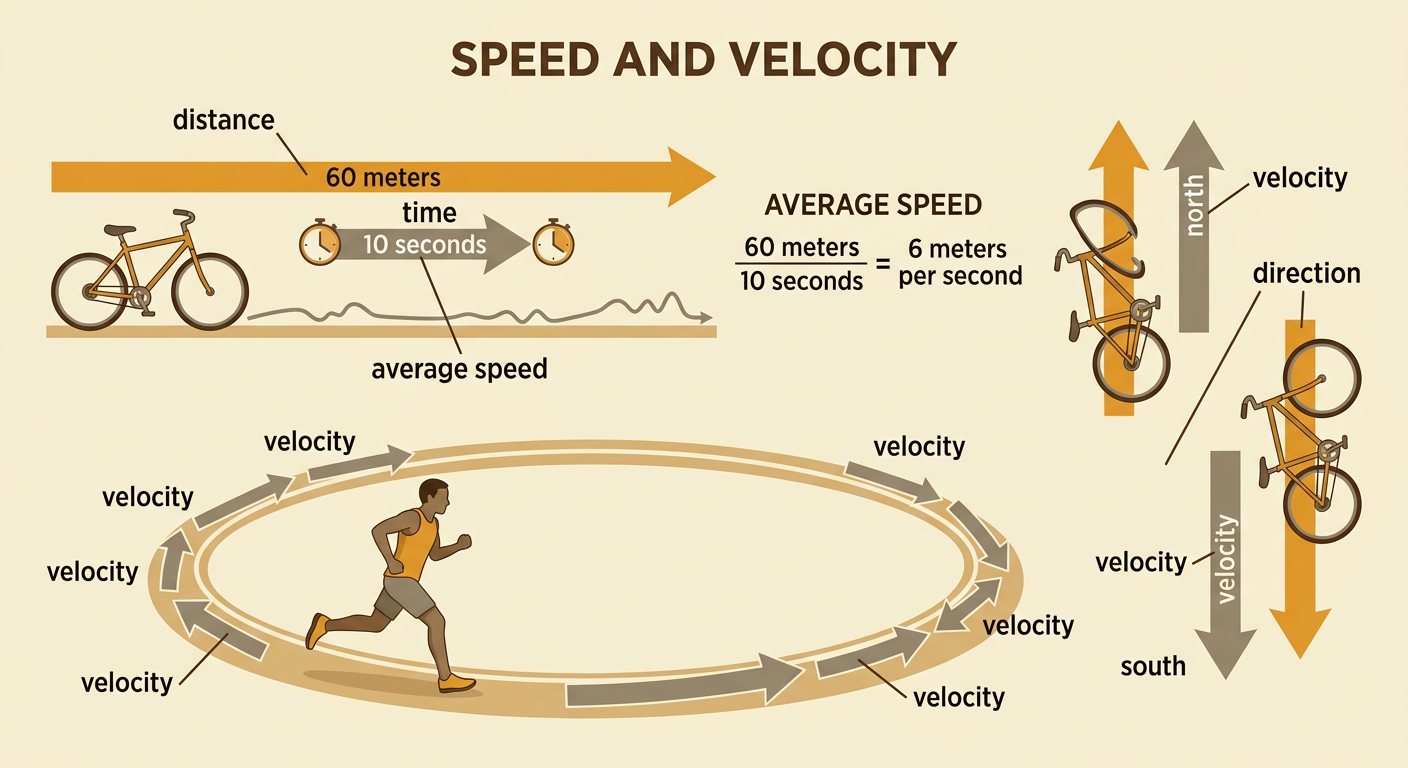
Speed measures how quickly an object travels a certain distance. It is calculated by dividing distance by time. A bicycle that travels 60 meters in 10 seconds has an average speed of 6 meters per second. Velocity includes both speed and direction. The bicycle's velocity might be 6 meters per second north. Two objects can have the same speed but different velocities if they move in different directions. Velocity also changes when an object turns, even if its speed stays the same. For example, a runner moving at a steady speed around a circular track continuously changes velocity because the runner's direction changes. Accurate units and directions make motion descriptions more useful.
Reading Position-Time Graphs
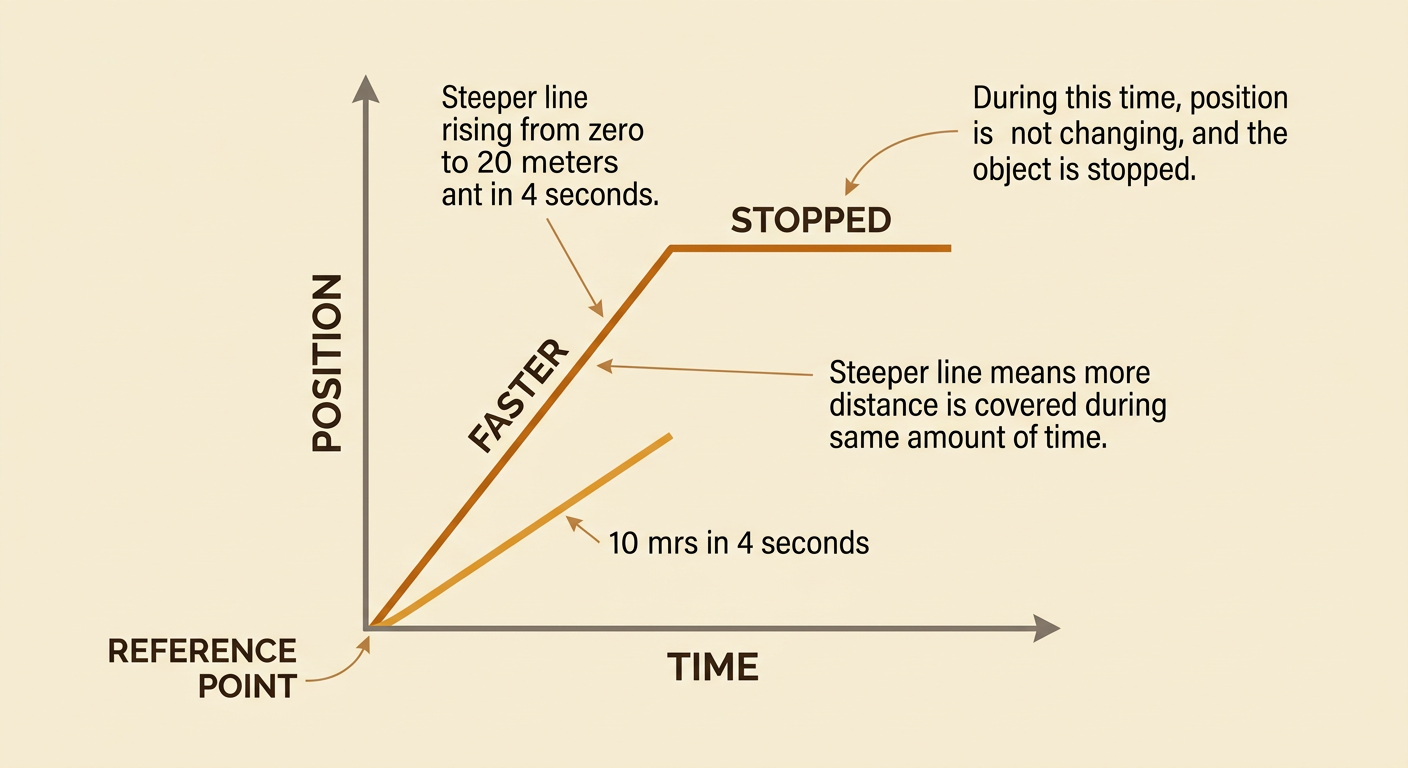
A position-time graph shows how an object's position changes as time passes. Time is usually placed on the horizontal axis, while position is placed on the vertical axis. A rising line means the object is moving farther from the reference point. A horizontal line means the position is not changing, so the object is stopped. A steeper line represents greater speed because more distance is covered during the same amount of time. For example, if one line rises from 0 to 20 meters in 4 seconds and another rises from 0 to 10 meters in 4 seconds, the first object moves faster. Graphs allow scientists to identify stops, changes in speed, and changes in direction.