
Describing Motion with Data and Graphs
Students use position, displacement, speed, velocity, and motion graphs to describe and compare one-dimensional motion.
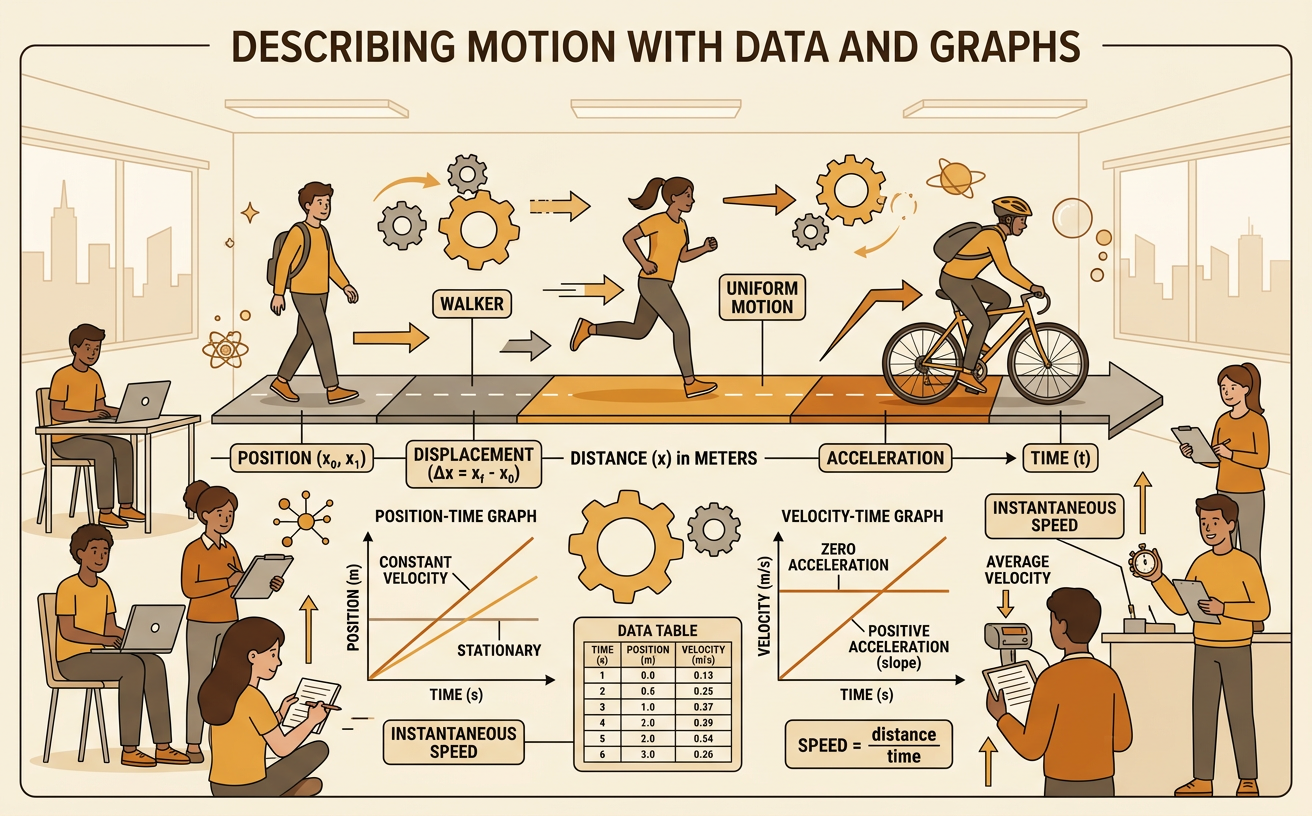
Illustrations are auto-generated and may be placeholders. They can be refreshed to match the narration.
Reference Frames and Position
Motion is described relative to a reference frame, which includes an origin, a coordinate axis, and a chosen positive direction. Position tells where an object is compared with the origin. In one-dimensional motion, position is represented by a coordinate such as x = +30 meters. The sign depends on the chosen positive direction, not on whether the object is moving. For example, suppose a tree is the origin and east is positive. A cyclist 30 meters east of the tree has a position of +30 meters, while a cyclist 15 meters west has a position of −15 meters. If the tree or positive direction were chosen differently, the coordinates would change even though the cyclists stayed in the same places. Always identify the reference frame before interpreting motion data.
Distance and Displacement
Distance and displacement describe different features of a trip. Distance is the total length of the path traveled, so it is a nonnegative scalar quantity. Displacement is the change in position from start to finish, so it includes direction and can be positive, negative, or zero. Displacement is calculated as final position minus initial position. For example, a student starts at x = 2 meters, walks to x = 10 meters, and then walks back to x = 6 meters. The student travels 8 meters forward and 4 meters backward, for a total distance of 12 meters. The displacement is 6 meters minus 2 meters, or +4 meters. Only the starting and ending positions determine displacement, while every part of the path contributes to distance.
Speed and Velocity
Speed measures how quickly distance is traveled, while velocity measures how quickly displacement changes. Average speed equals total distance divided by elapsed time. Average velocity equals displacement divided by elapsed time and includes a direction or sign. Suppose a student walks 60 meters east and then 20 meters west in 40 seconds. The total distance is 80 meters, so the average speed is 2 meters per second. The displacement is 40 meters east, so the average velocity is 1 meter per second east. Speed cannot be negative, but one-dimensional velocity can be negative when motion is opposite the chosen positive direction. Instantaneous speed and velocity describe motion at a particular moment, such as the reading and direction shown by a vehicle’s speedometer and motion.
Position-Time Graphs
A position-time graph shows an object’s position on the vertical axis and time on the horizontal axis. Each plotted point states where the object is at a particular time. The slope of a line segment equals velocity: a positive slope represents positive velocity, a horizontal segment represents rest, and a negative slope represents negative velocity. A steeper slope has a greater velocity magnitude. For example, an object moves from 0 meters at 0 seconds to 20 meters at 4 seconds, giving a velocity of +5 meters per second. It remains at 20 meters until 6 seconds, so its velocity is zero. It then moves to 8 meters by 10 seconds, giving a velocity of −3 meters per second. Changes in vertical position show displacement during each time interval.
Velocity-Time Graphs
A velocity-time graph shows velocity on the vertical axis and time on the horizontal axis. Points above the time axis represent positive velocity, points below it represent negative velocity, and points on the axis represent zero velocity. The signed area between the graph and the time axis gives displacement. For example, an object travels at +4 meters per second from 0 to 3 seconds, producing a displacement of +12 meters. It remains stopped from 3 to 5 seconds, adding no displacement. It then travels at −2 meters per second from 5 to 9 seconds, producing a displacement of −8 meters. The net displacement is +4 meters. The slope of a velocity-time graph represents acceleration, so a horizontal segment indicates constant velocity and zero acceleration.