Describing Motion with Speed and Graphs
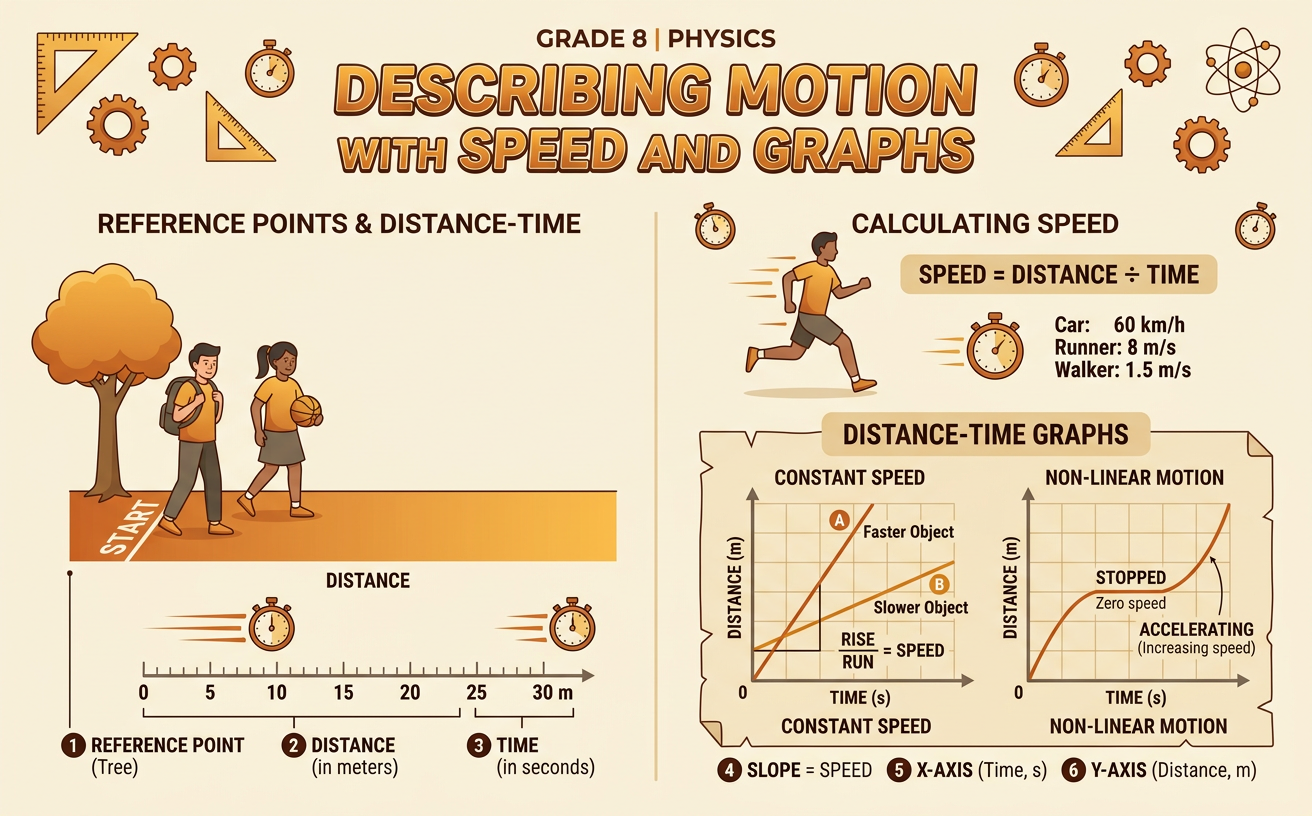
Students use distance, time, reference points, and linear graphs to describe and compare the motion of objects.
Illustrations are auto-generated and may be placeholders. They can be refreshed to match the narration.
Motion and Reference Points
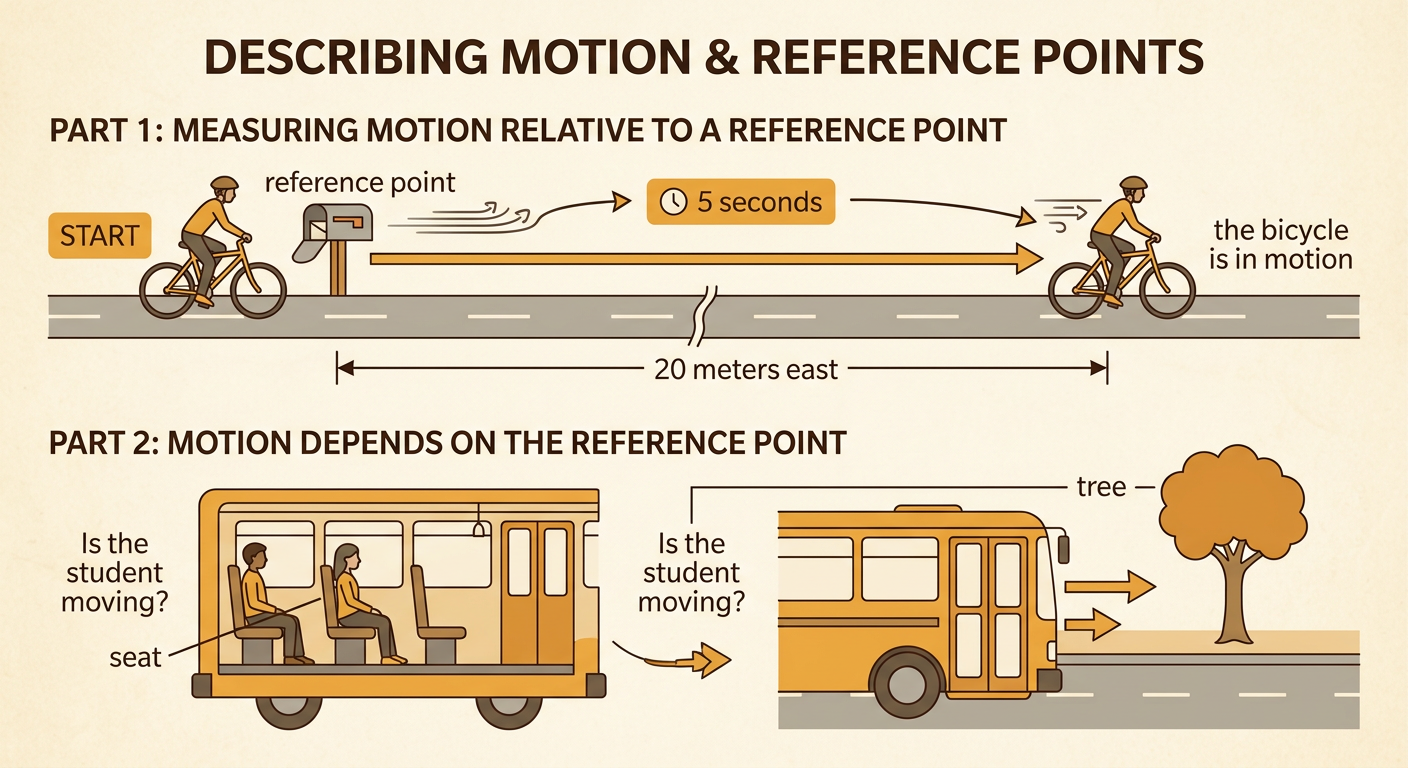
Motion is a change in an object’s position over time compared with a reference point. A reference point is a place or object treated as staying still while motion is observed. For example, suppose a bicycle is beside a mailbox and then is 20 meters east of the mailbox five seconds later. The mailbox is the reference point, so the bicycle has changed position and is in motion relative to it. Motion can look different from different reference points. A student sitting on a moving bus is not moving relative to the seat, but the student is moving relative to a tree beside the road. To describe motion clearly, identify the reference point, the object’s position, the direction of motion, and the time interval.
Distance and Time
Distance tells how much ground an object travels, and time tells how long the motion lasts. Common distance units include meters and kilometers, while common time units include seconds and hours. To study motion, measurements can be organized in a table with time in one column and distance in another. Suppose a toy car starts at zero meters and travels 3 meters every second. After 1 second, it has traveled 3 meters; after 2 seconds, 6 meters; and after 3 seconds, 9 meters. The equal increases show a linear relationship between distance and time. Time is the independent quantity because it is placed along the horizontal axis. Distance is the dependent quantity because its value changes as time passes. Consistent units make comparisons and calculations accurate.

Calculating Average Speed
Average speed describes how much distance an object travels per unit of time. Calculate it by dividing total distance by total time: average speed equals total distance divided by total time. If a runner travels 150 meters in 30 seconds, the runner’s average speed is 150 divided by 30, or 5 meters per second. This means the runner covers an average of 5 meters during each second. Average speed does not reveal every change during the trip. The runner may speed up, slow down, or stop briefly and still have an average speed of 5 meters per second. When motion occurs at a constant speed, distance and time have a linear relationship. For this runner, the model is distance equals 5 times time, where the rate of change is 5 meters per second.

Reading Motion Graphs
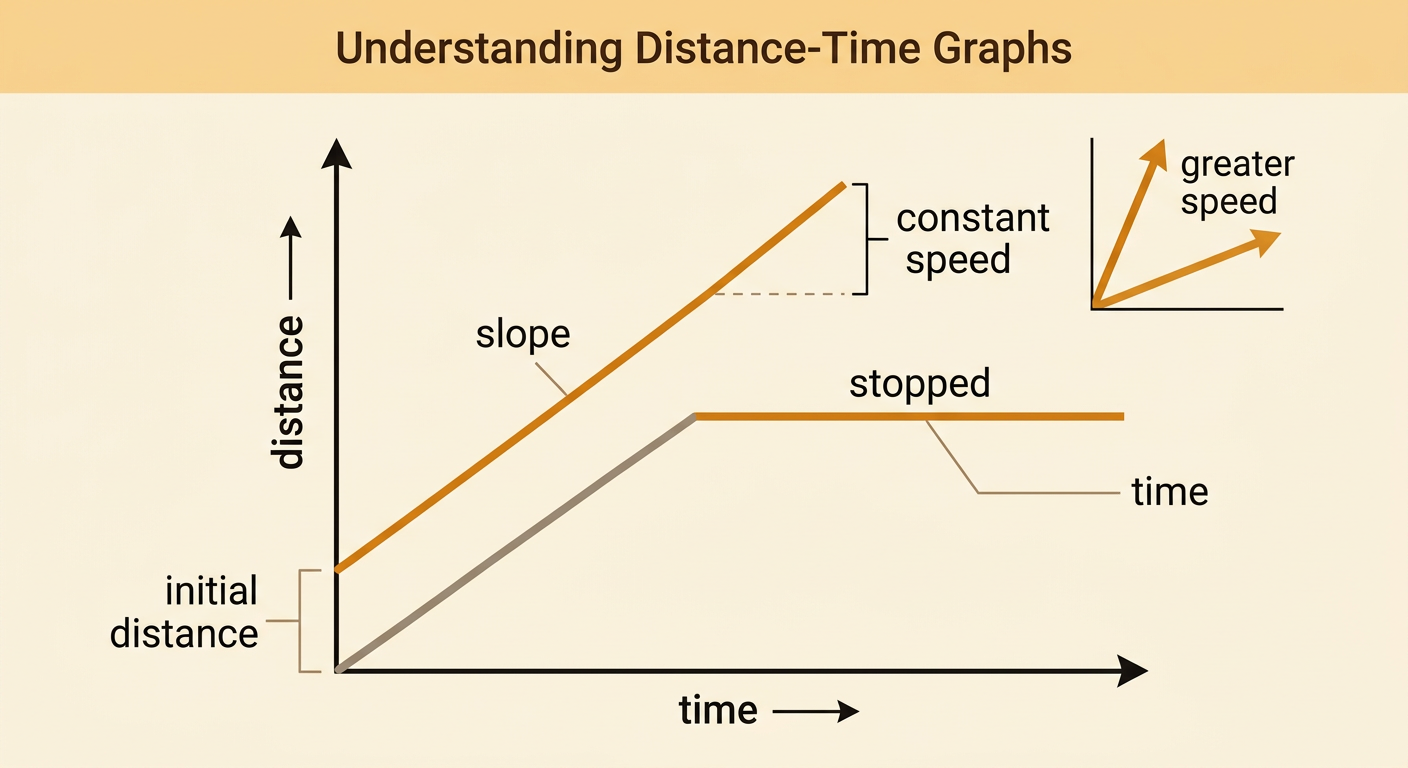
A distance-time graph shows how an object’s distance changes as time passes. Time is plotted on the horizontal axis, and distance is plotted on the vertical axis. Each point represents the object’s distance at a particular time. The slope, or steepness, of a line is the rate of change and represents speed. A steeper upward line means a greater speed. A straight upward line shows constant speed because equal distances are added during equal time intervals. A horizontal segment shows that distance is not changing, so the object is stopped. The vertical intercept gives the object’s initial distance when time is zero. For example, a line passing through zero meters at zero seconds and 20 meters at four seconds has a slope of 5 meters per second and an initial value of zero meters.
Comparing Moving Objects
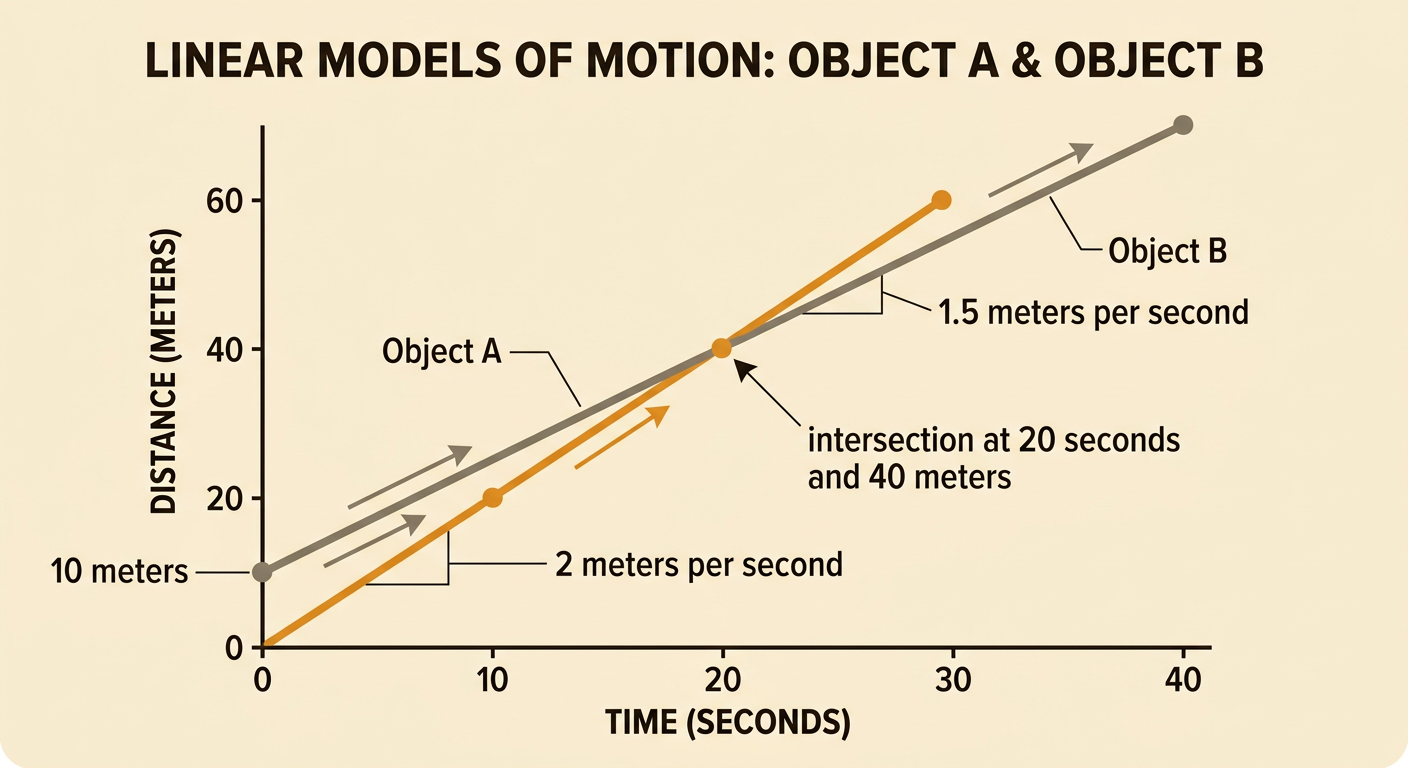
Linear models and graphs make it possible to compare moving objects. Consider Object A, modeled by distance equals 2 times time, and Object B, modeled by distance equals 1.5 times time plus 10. Object A has a rate of change of 2 meters per second and starts at 0 meters. Object B moves more slowly at 1.5 meters per second but has an initial value of 10 meters, meaning it begins 10 meters ahead of the reference point. On a graph, Object A has the steeper line, while Object B crosses the vertical axis at 10 meters. The lines meet after 20 seconds at 40 meters. Before that time, Object B is farther from the reference point. After that time, Object A is farther away because its greater speed allows it to pass Object B.