
Designing and Querying a Relational Database
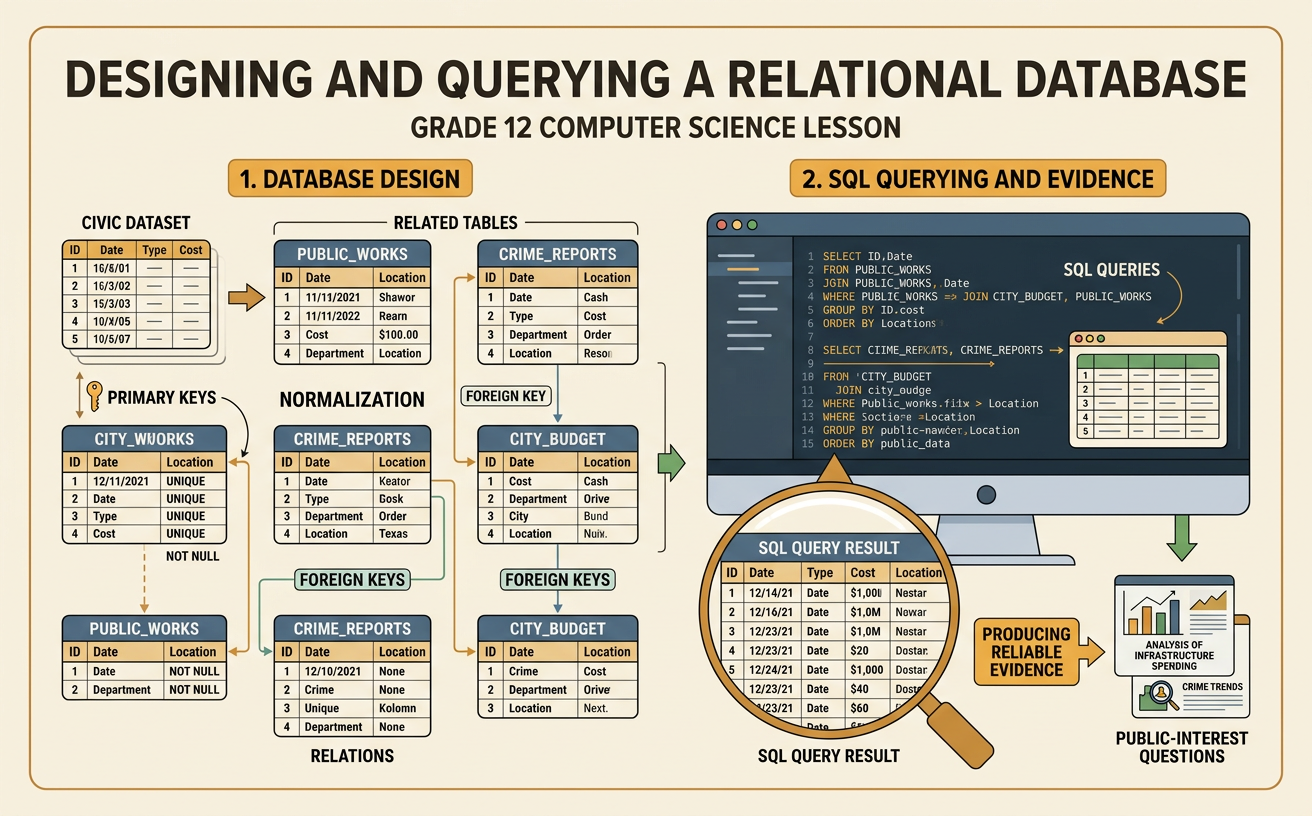
Students organize a civic data set into related tables, apply keys and constraints, and write SQL queries that produce reliable evidence for a public-interest question.
Illustrations are auto-generated and may be placeholders. They can be refreshed to match the narration.
From Raw Data to Tables
A city data portal may provide one spreadsheet of service requests and a Census Bureau file of neighborhood populations. Begin by identify the grain of each source: one row in the request file represents one service request, while one row in the population file represents one neighborhood. Preserve unchanged copies of both files, then organize selected fields into tables. A Requests table might contain RequestID, OpenedDate, ClosedDate, Category, AgencyID, and NeighborhoodID. Separate Agencies and Neighborhoods tables store descriptive information about those entities. A Sources table can record each file’s publisher, URL, publication date, and retrieval date. This structure turns messy files into an abstract model while preserving quantitative meaning. Before importing, standardize date formats and category spellings, but never silently change an original value.

Primary and Foreign Keys
A primary key uniquely identifies every row in a table. In Requests, RequestID can be the primary key because two requests must not share the same identifier. AgencyID can identify each row in Agencies, and NeighborhoodID can identify each row in Neighborhoods. A foreign key connects one table to another. Requests.AgencyID refers to Agencies.AgencyID, while Requests.NeighborhoodID refers to Neighborhoods.NeighborhoodID. These rules prevent a request from naming an agency or neighborhood that does not exist in the related table. For example, a request with NeighborhoodID 17 is linked to the single neighborhood row whose primary key is 17. Useful constraints include PRIMARY KEY, FOREIGN KEY, NOT NULL, and UNIQUE. A nullable ClosedDate is appropriate, however, because an open request has not yet been closed.

Normalization and Data Integrity
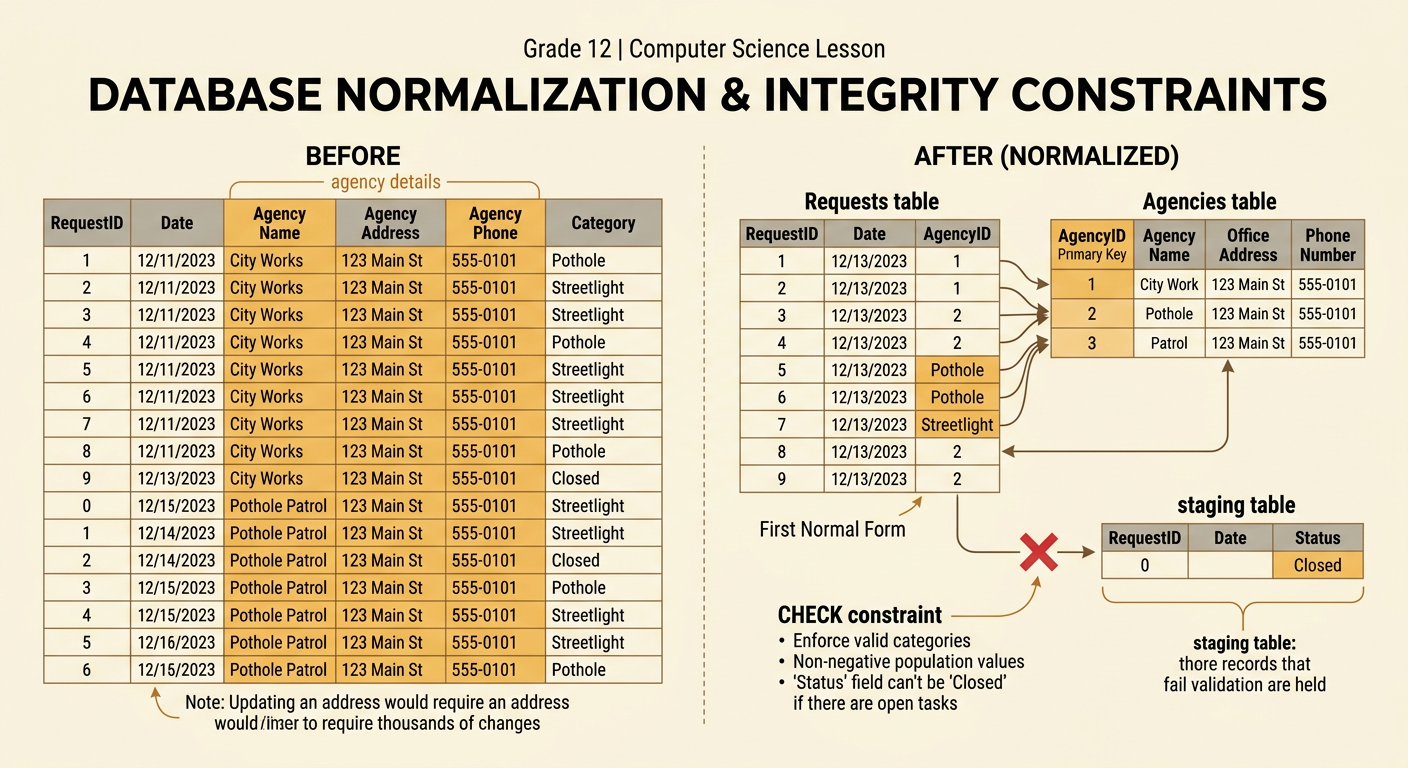
Normalization reduces duplication by storing each fact in an appropriate table. Suppose every request row repeats the agency name, office address, and phone number. If the agency moves, thousands of rows would need updates, and conflicting addresses could remain. Instead, store those facts once in Agencies and place only AgencyID in Requests. First normal form also requires each field to hold one value, so a cell should not contain a list such as “pothole, streetlight.” Integrity rules can require valid dates, allowed categories, and nonnegative population values. For example, CHECK (ClosedDate >= OpenedDate) rejects an impossible timeline when both dates exist. Designers must evaluate trade-offs: stronger constraints improve reliability but may reject unusual yet legitimate source records. A staging table can preserve questionable rows for review instead of deleting evidence.
Writing SELECT and JOIN Queries
A public-interest question might ask which neighborhoods had the highest rate of pothole requests in 2024. A SELECT query can join request records to neighborhood population data and calculate a comparable rate. For example: SELECT n.Name, 10000.0 * COUNT(r.RequestID) / n.Population AS RequestsPer10000 FROM Neighborhoods n LEFT JOIN Requests r ON n.NeighborhoodID = r.NeighborhoodID AND r.Category = 'Pothole' AND r.OpenedDate >= '2024-01-01' AND r.OpenedDate < '2025-01-01' GROUP BY n.Name, n.Population ORDER BY RequestsPer10000 DESC; The LEFT JOIN retains neighborhoods with zero matching requests. Placing the category and date conditions in the ON clause prevents those zero-count neighborhoods from disappearing. Dividing by population translates raw counts into rates, allowing more meaningful comparison between neighborhoods of different sizes. Always name calculated columns and confirm that the denominator matches the question.

Checking Results Against the Source
A query result is evidence only after it has been checked against its sources. First, compare imported row counts, date ranges, and category totals with the original city file. Test for unmatched relationships with SELECT COUNT(*) FROM Requests r LEFT JOIN Neighborhoods n ON r.NeighborhoodID = n.NeighborhoodID WHERE n.NeighborhoodID IS NULL; A result above zero signals missing or mismatched neighborhood identifiers. Next, spot-check several requests by comparing their dates, categories, and agencies with the portal records. Review the authority and context of each source: a city operations system may be authoritative for requests, while the Census Bureau may be stronger for population. Corroborate major patterns with an annual city report when possible. Document the source URL, data snapshot date, time zone, exclusions, null-value rules, and query text so another person can reproduce and evaluate the conclusion.
