
Detecting and Reducing Bias in Algorithms
Students analyze a simplified automated decision-making algorithm, identify potential sources of bias, and propose improvements based on evidence, criteria, and societal trade-offs.
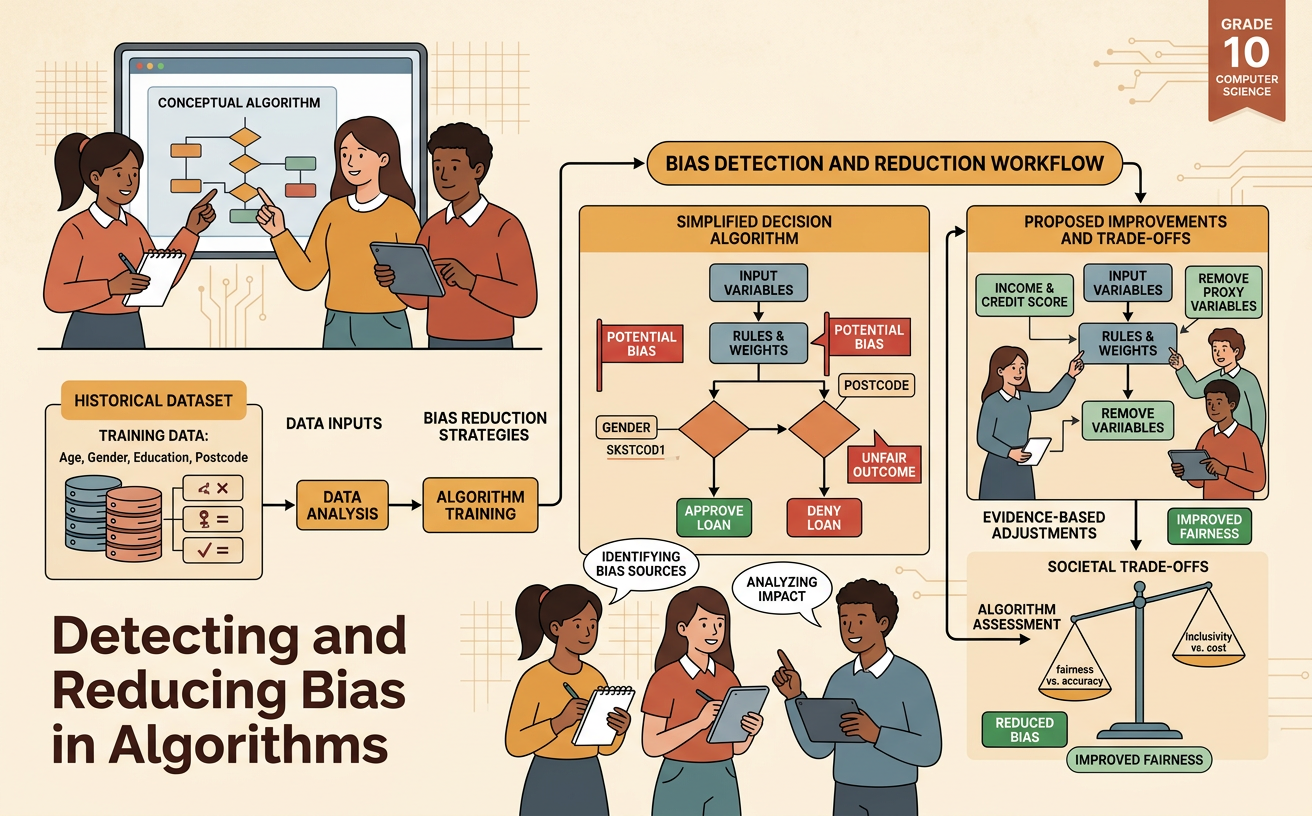
Illustrations are auto-generated and may be placeholders. They can be refreshed to match the narration.
How Algorithms Make Decisions
An algorithm is a set of instructions for turning inputs into outputs. In automated decision-making, designers choose which data to use, how much each factor matters, and what action follows a result. Consider an internship-screening algorithm. It gives applicants points for relevant courses, work experience, and teacher recommendations. Applicants earning 70 points or more receive an interview. Although the computer applies the rule consistently, the result is not automatically fair. The chosen inputs may reflect unequal opportunities. For example, work experience may favor students who could afford unpaid internships. A technical claim such as “the algorithm selects the most qualified applicants” must therefore be checked. We should examine the rule, the data behind it, and evidence showing whether its scores actually predict successful job performance.

Testing a Sample Decision Rule
To test a decision rule, apply it to sample cases and compare the outcomes. Suppose an algorithm awards up to 40 points for courses, 35 for work experience, and 25 for recommendations. Maya earns 35, 15, and 22 points, for a total of 72, so she receives an interview. Jordan earns 32, 10, and 25 points, totaling 67, so Jordan does not. This test confirms that the arithmetic follows the stated rule, but it also raises questions. Maya and Jordan have similar academic and recommendation scores, yet a five-point difference around the cutoff changes the outcome. Testing many cases can reveal how sensitive results are to small differences. It can also show whether the algorithm’s decisions match later evidence, such as supervisor ratings of applicants who were hired.

Identifying Data and Design Bias
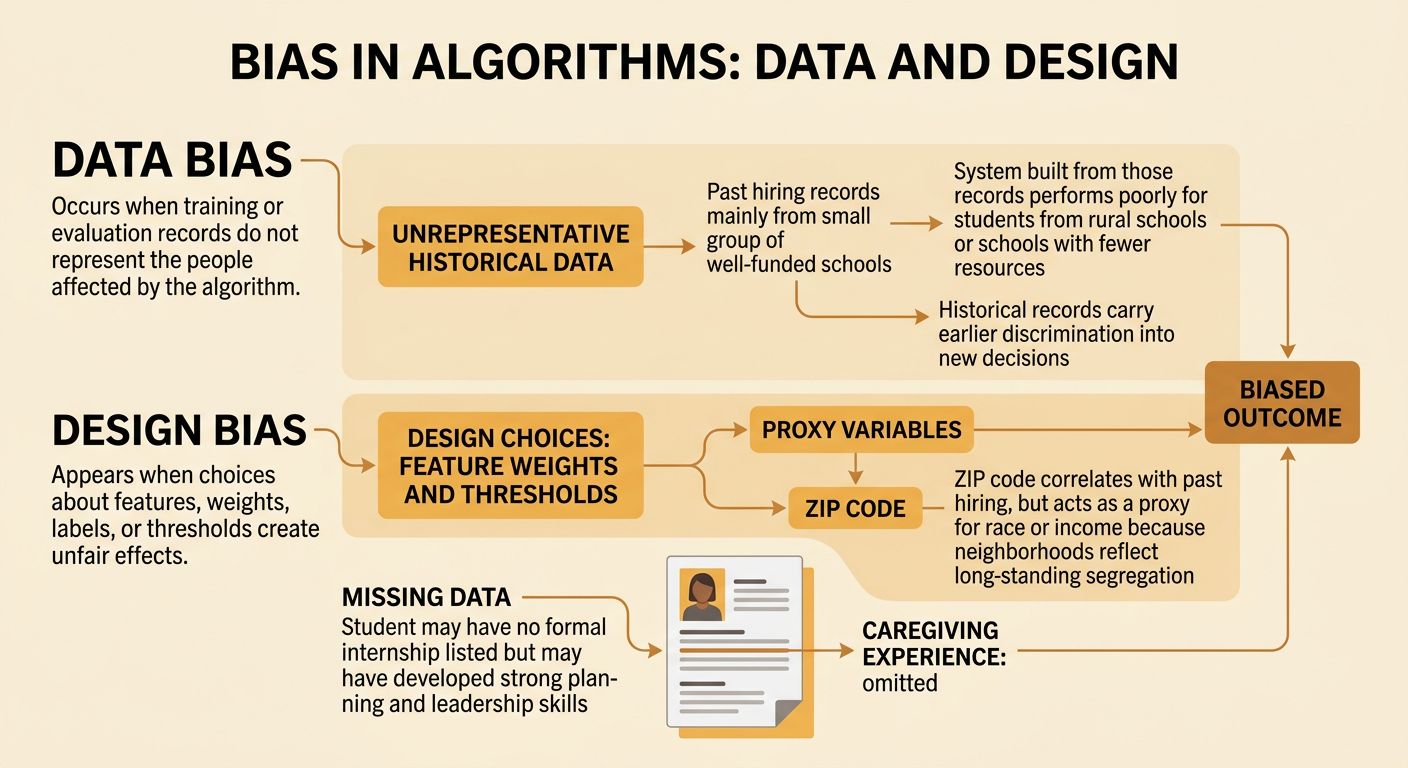
Bias can enter through both data and design choices. Data bias occurs when training or evaluation data do not represent the people affected. For example, if an internship algorithm was built from records of past hires from a small group of well-funded schools, it may not work equally well for students from other schools. Historical data can also preserve earlier discrimination. Design bias occurs when developers choose features, weights, labels, or thresholds that create unfair effects. A home ZIP code might appear useful because it correlates with past hiring, but it can act as a proxy for race or income because neighborhoods often reflect long-standing segregation. Missing data matter too: students without formal work experience may still have relevant skills from caregiving or community projects. Identifying bias requires asking who is represented, who is missing, and which assumptions shape the rule.
Evaluating Evidence and Trade-Offs
A fairness claim should be supported by relevant evidence, not just an overall accuracy number. Review selection rates, error rates, and later job performance for different groups. For example, suppose an algorithm is 82 percent accurate overall, but it incorrectly rejects 30 percent of qualified rural applicants and 10 percent of qualified urban applicants. That difference challenges a claim that the system performs equally well for everyone. Evaluators should also examine sample size, data quality, and whether another explanation fits the results. Improvements involve trade-offs. Removing ZIP code may reduce unequal effects but slightly lower predictive accuracy. Adding human review may catch unusual cases but increase cost, time, and inconsistency. A strong evaluation prioritizes fairness, reliability, privacy, safety, and access while clearly explaining which benefits and burdens different communities may experience.

Redesigning for Greater Fairness
A fairer redesign begins with measurable criteria. A team might require similar false-rejection rates across groups, reliable prediction of job performance, protection of private data, and a practical review cost. For the internship algorithm, the team could remove ZIP code, recognize caregiving and community work as relevant experience, reduce the weight of formal internships, and add human review for scores within five points of the cutoff. It should then test the revised system on representative data and compare results with the original version. No single change guarantees fairness, and fairness measures can conflict. Equal selection rates, equal error rates, and maximum accuracy may not all be possible at once. Designers should document their priorities, invite feedback from affected students and schools, monitor outcomes over time, and provide an appeal process when a decision appears incorrect.