Distinguishing Surveys, Experiments, and Observational Studies
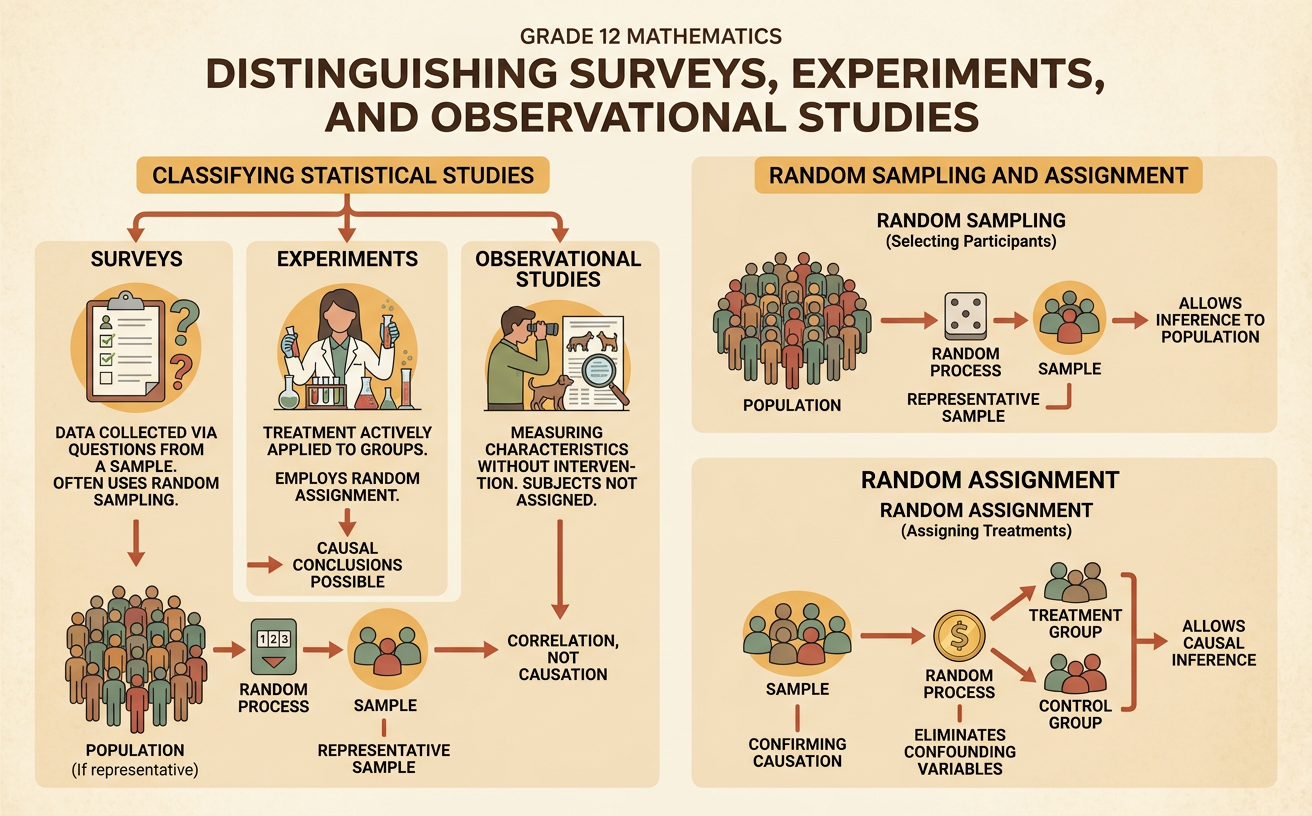
Classify statistical studies and explain how random sampling and random assignment affect the conclusions that can be drawn.
Illustrations are auto-generated and may be placeholders. They can be refreshed to match the narration.
Three Types of Statistical Studies
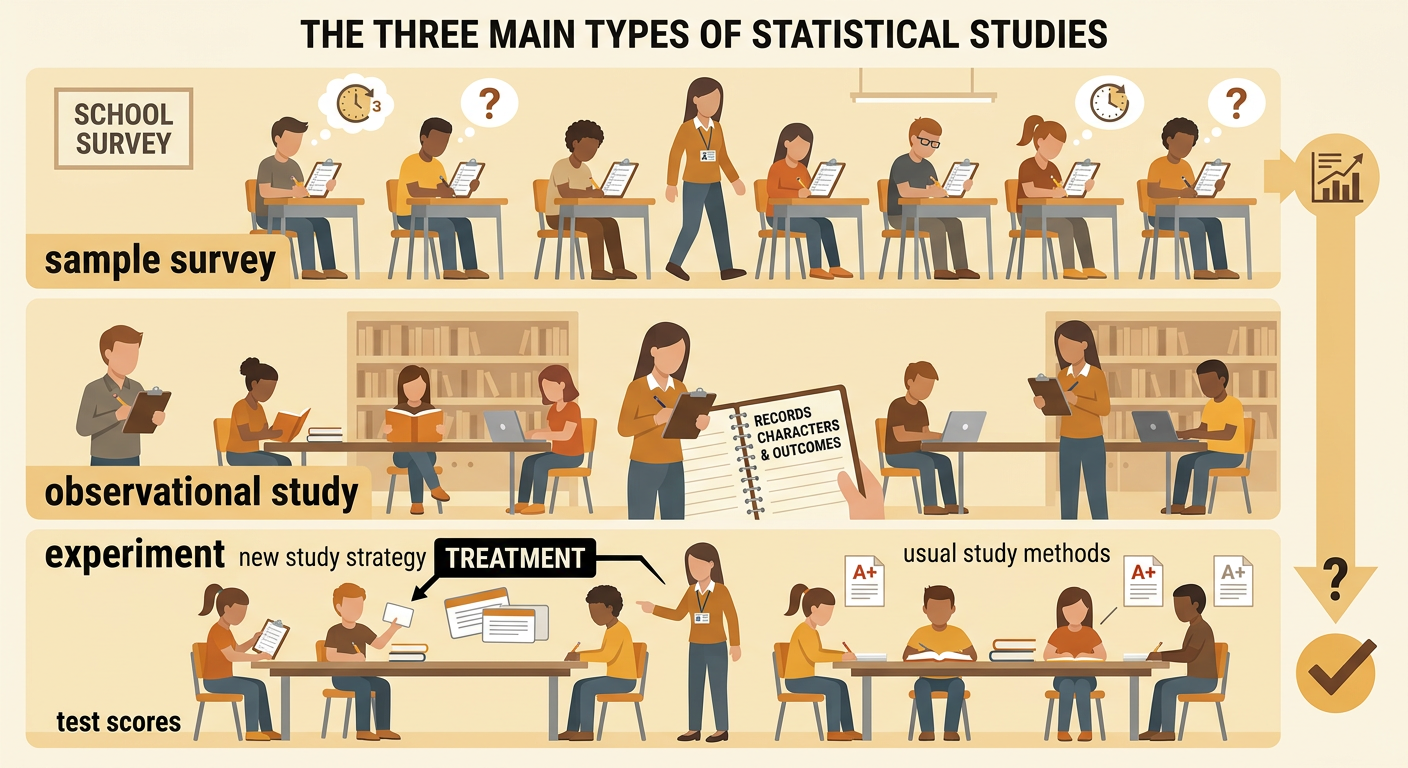
A sample survey collects information by asking questions of part of a population. For example, a school might ask 300 seniors how many hours they study each week. An observational study records characteristics or outcomes without assigning conditions. Researchers might observe seniors’ study time and grades but allow students to choose their own habits. An experiment deliberately imposes treatments and measures the resulting responses. Researchers could assign students to use either a new study strategy or their usual strategy and then compare test scores. The key distinction is whether researchers impose a treatment. Surveys ask people to report information, while observational studies may use measurements, records, or direct observation. Neither imposes a treatment. Experiments do impose treatments so that researchers can compare their effects.
Random Sampling and Representative Data
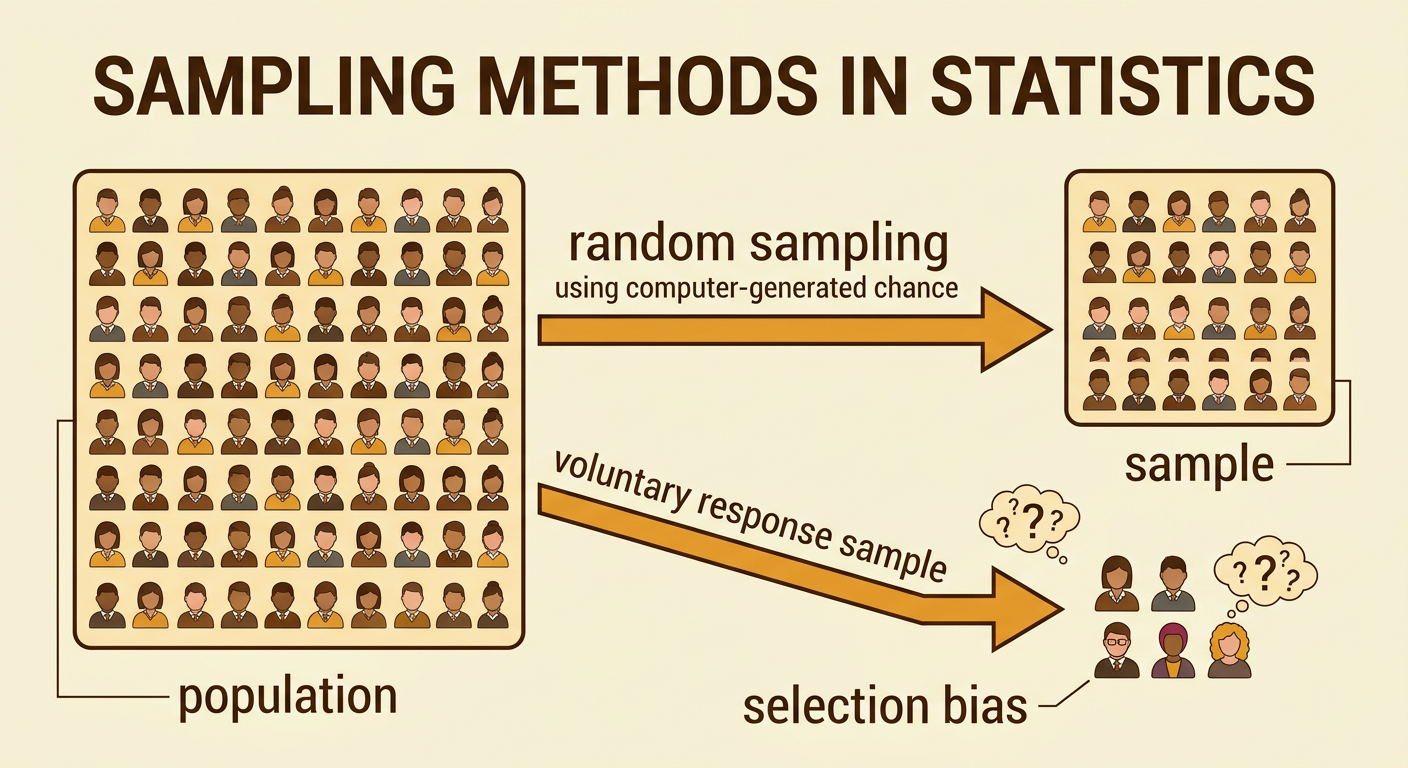
Random sampling is a method for selecting individuals so that chance determines who enters the sample. Its purpose is to create a sample that represents the larger population and to reduce selection bias. Suppose a district wants to estimate the average amount of homework completed by its 2,000 seniors. It could use a computer to randomly select 200 seniors from the complete enrollment list. Results from this sample can reasonably be generalized to all district seniors if nonresponse and other biases are limited. In contrast, posting an optional online poll may attract students with unusually strong opinions or study habits. That voluntary response sample may not represent the population. Random sampling supports generalization from a sample to a population, but it does not by itself establish that one variable causes another.
Random Assignment and Treatment Groups
Random assignment uses chance to place experimental subjects into treatment groups. Its purpose is to create groups that are similar before the treatments begin, including with respect to lurking variables that researchers may not have measured. Suppose 120 student volunteers enter an experiment about an online tutoring program. A random process assigns 60 students to use the program and 60 to continue with the usual resources. The usual-resources group serves as the control group. If the groups follow the assigned conditions and show a meaningful difference in final scores, the researchers may attribute that difference to the tutoring program. Random assignment supports cause-and-effect conclusions, while random sampling supports conclusions about a population. An experiment can use random assignment without using random sampling, but its conclusions may then apply only to participants similar to the volunteers.

Association Versus Causation
An association occurs when two variables tend to vary together, but association alone does not prove causation. For example, an observational study might find that students who sleep more earn higher test scores. More sleep could improve performance, but other variables may help explain the pattern. Students with less demanding work schedules might both sleep more and have more time to study. Work schedule is then a possible confounding variable. Because researchers did not assign sleep amounts, they cannot confidently conclude that additional sleep caused the higher scores. A well-designed randomized experiment can provide stronger evidence of causation because random assignment tends to distribute confounding variables across treatment groups. Even then, researchers must consider whether the experiment was ethical, whether participants followed their assignments, and whether the measured difference could reasonably be due to chance.

Classifying Studies and Evaluating Conclusions
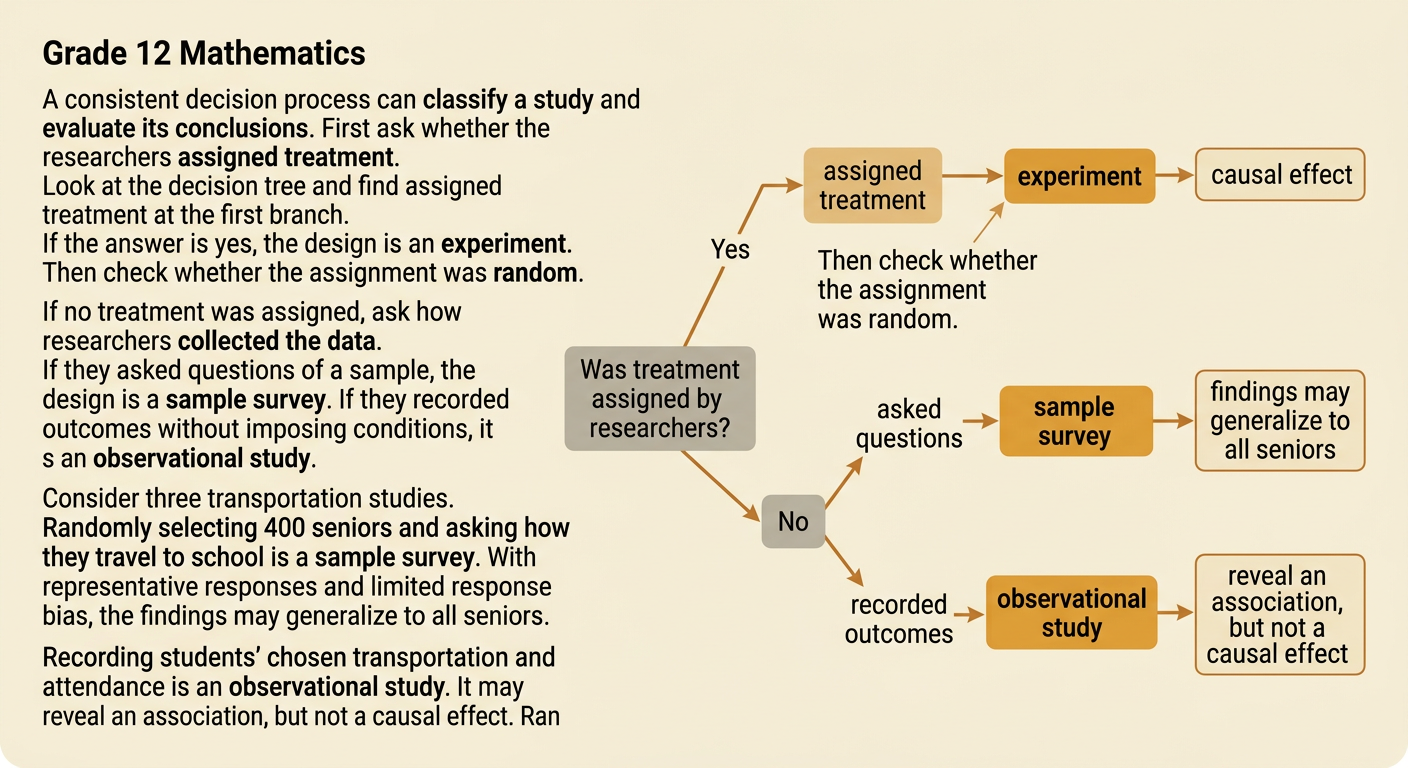
To classify a study, first ask whether researchers assigned a treatment. If they did, the study is an experiment; then check whether assignment was random. If no treatment was assigned, determine whether researchers asked a sample questions or simply recorded existing behavior and outcomes. For example, randomly selecting 400 seniors and asking about transportation to school is a sample survey. Its results may be generalized to the senior population if the sample is representative and response bias is limited. Recording students’ chosen transportation and attendance is an observational study, so any relationship found is an association. Randomly assigning volunteers to receive free bus passes or no passes is an experiment that can test whether the passes affect attendance. Evaluate every conclusion by checking sampling, assignment, nonresponse, measurement methods, group size, and whether the claim concerns a population, an association, or a causal effect.