
Earth’s Water: Where Is It Found?
Students interpret maps, data, and simple graphs to compare how Earth’s water is distributed among oceans, glaciers, groundwater, lakes, and rivers.

Illustrations are auto-generated and may be placeholders. They can be refreshed to match the narration.
Earth’s Saltwater and Freshwater
Earth has a great deal of water, but most of it is saltwater. About 97 percent of Earth’s water is in oceans. Saltwater contains too much dissolved salt for people to drink without special treatment. Only about 3 percent of Earth’s water is freshwater. Most freshwater is frozen in glaciers and ice sheets or stored underground as groundwater. A very small amount is found in lakes and rivers. Imagine 100 equal cups representing all of Earth’s water. About 97 cups would contain saltwater, while only 3 cups would contain freshwater. Even those 3 cups would not all be easy to reach. This comparison shows why protecting available freshwater is important, even though water covers most of Earth’s surface.

Reading a Water Distribution Map
A water distribution map uses colors and symbols to show where water is found. On a world map, oceans appear as large connected areas surrounding the continents. Glaciers and ice sheets are concentrated in Antarctica, Greenland, and high mountain regions. Lakes and rivers appear on land, but they cover much less area than oceans. Groundwater cannot be seen from above, so maps may represent it with shading, patterns, or a cross-section below the ground. For example, a map of North America might show the Great Lakes as large freshwater bodies along the United States–Canada border. A legend explains what each color or symbol means. By comparing the map, legend, and locations, students can connect environmental characteristics, such as cold climates, with the presence of frozen water.

Representing Water Amounts with Fractions
Fractions can represent parts of Earth’s total water supply. If all of Earth’s water is divided into 100 equal parts, about 97 parts are saltwater and 3 parts are freshwater. The fraction 97/100 means 97 divided by 100, which equals 0.97, or 97 percent. The fraction 3/100 means 3 divided by 100, which equals 0.03, or 3 percent. For a concrete model, imagine 100 water tokens. Place 97 tokens in an ocean group and 3 tokens in a freshwater group. The denominator, 100, tells the total number of equal parts. The numerator tells how many parts belong to a category. Fractions make it possible to compare water amounts even when the actual volume of Earth’s water is extremely large.

Graphing Earth’s Water Sources
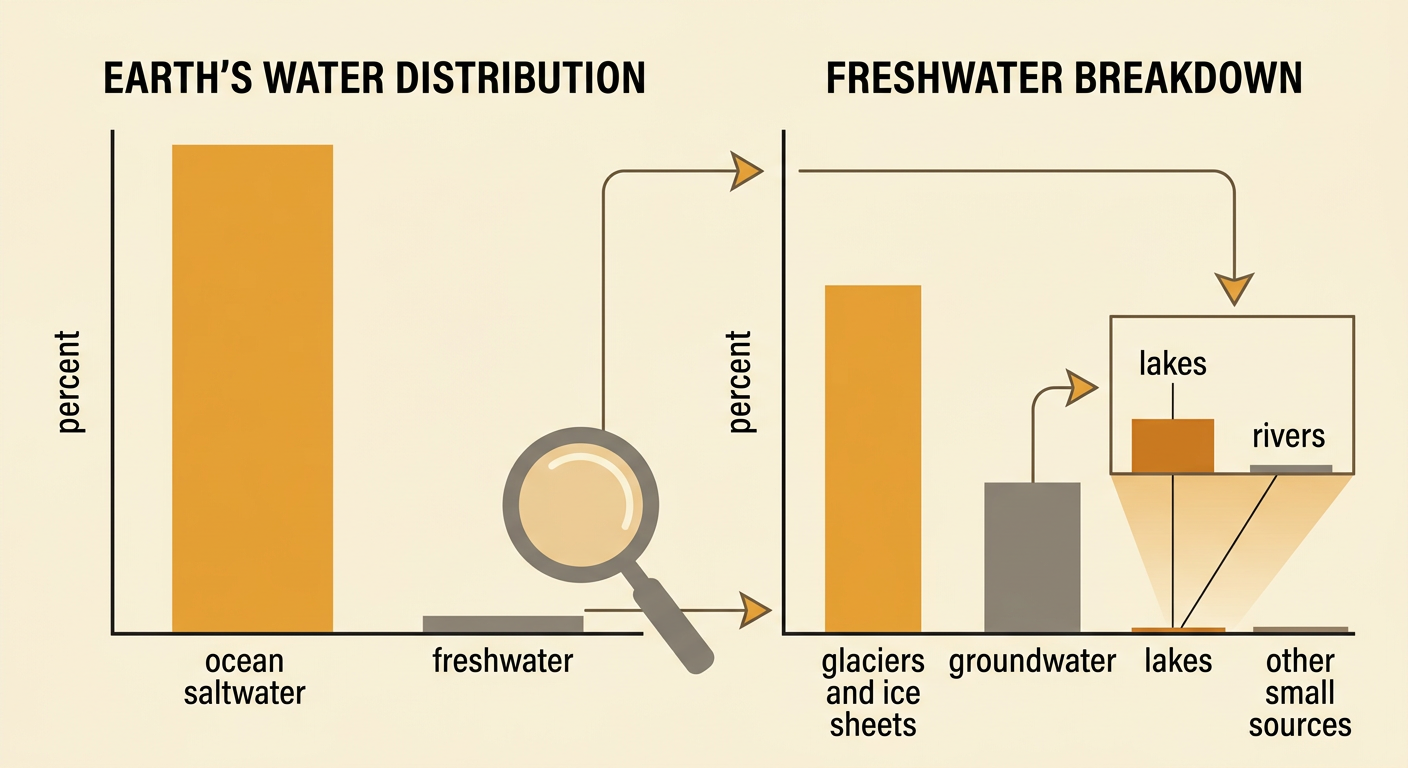
Graphs make differences in water amounts easier to compare. A useful display has two bar graphs. The first graph shows that about 97 percent of all Earth’s water is ocean saltwater and about 3 percent is freshwater. The second graph enlarges that small freshwater portion. Of Earth’s freshwater, about 69 percent is frozen in glaciers and ice sheets, about 30 percent is groundwater, and less than 1 percent is in lakes, rivers, and other small sources. On each graph, the horizontal axis names the water sources, and the vertical axis shows percent. For example, the glacier bar should be more than twice as tall as the groundwater bar because 69 is more than twice 30. Titles, labels, and consistent scales help readers interpret the data correctly.
Explaining Where Usable Freshwater Is Found
Usable freshwater is water that people and other organisms can reach and use, but it may still require cleaning. Much of Earth’s freshwater is locked in glaciers and ice sheets, far from many communities. Groundwater stored in cracks and spaces within soil and rock can be reached by wells. Lakes, rivers, and reservoirs provide surface water that is usually easier to access, but they contain only a tiny share of Earth’s water. For example, a town might pump groundwater from an aquifer, while another town draws water from a nearby river. Maps can help explain these choices by showing rivers, lakes, landforms, rainfall patterns, and population locations. Because accessible freshwater is limited and unevenly distributed, communities must prevent pollution, avoid waste, and manage local water supplies carefully.
