Electric and Magnetic Forces at a Distance
Students investigate and graph how distance, charge, and magnetic pole orientation affect the strength and direction of noncontact forces.
Illustrations are auto-generated and may be placeholders. They can be refreshed to match the narration.
Introducing Noncontact Forces
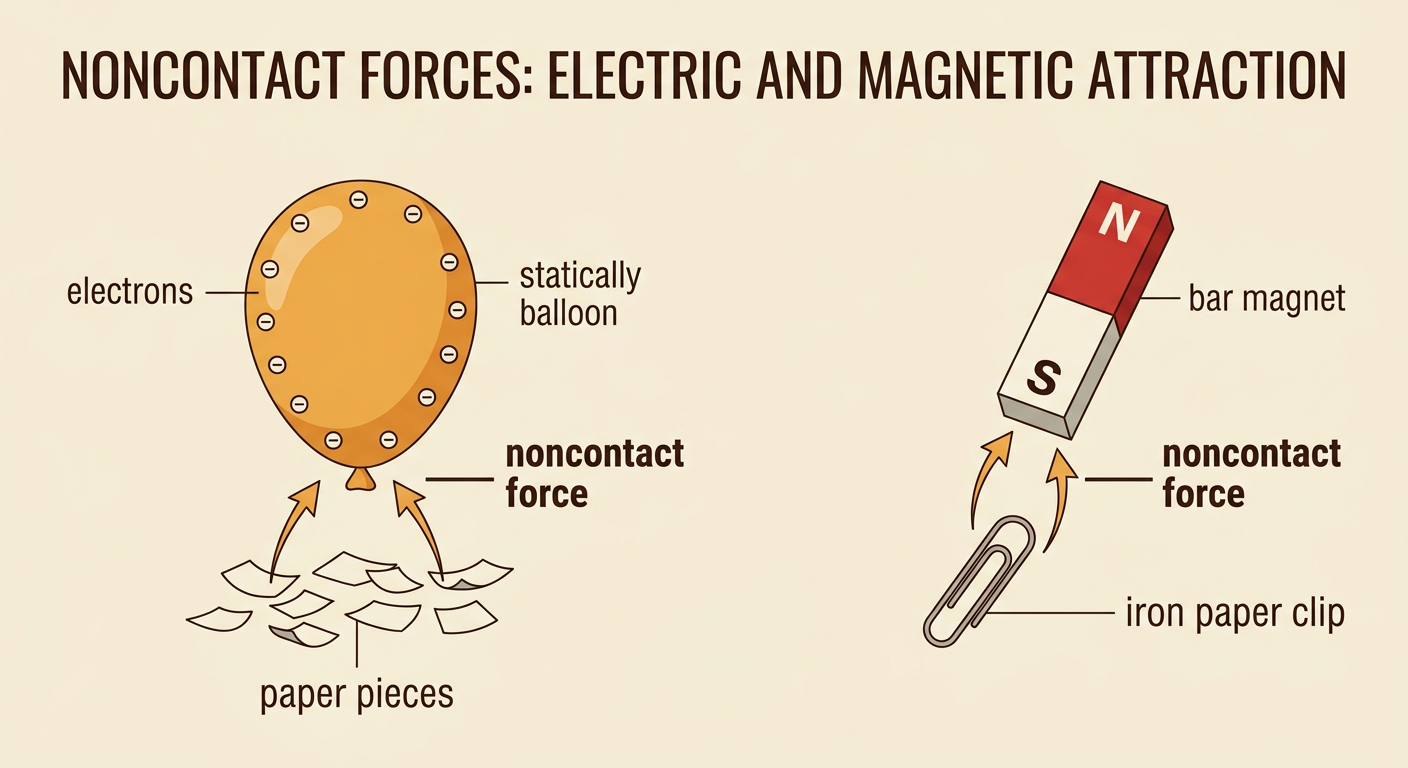
Electric and magnetic forces can push or pull objects without the objects touching. These interactions are called noncontact forces. Electric force acts between charged objects. For example, rubbing a balloon on hair transfers electrons, leaving the balloon charged. The charged balloon can then attract small paper pieces from a short distance. Magnetic force acts between magnets or between a magnet and certain materials, such as iron. A bar magnet can pull an iron paper clip without direct contact. In both cases, the force becomes detectable through an object's motion, but the space between the objects remains visible. Scientists ask testable questions to identify which factors affect these forces. One useful question is, “How does increasing the distance between two charged objects change the strength of their attraction?”
Testing Attraction and Repulsion
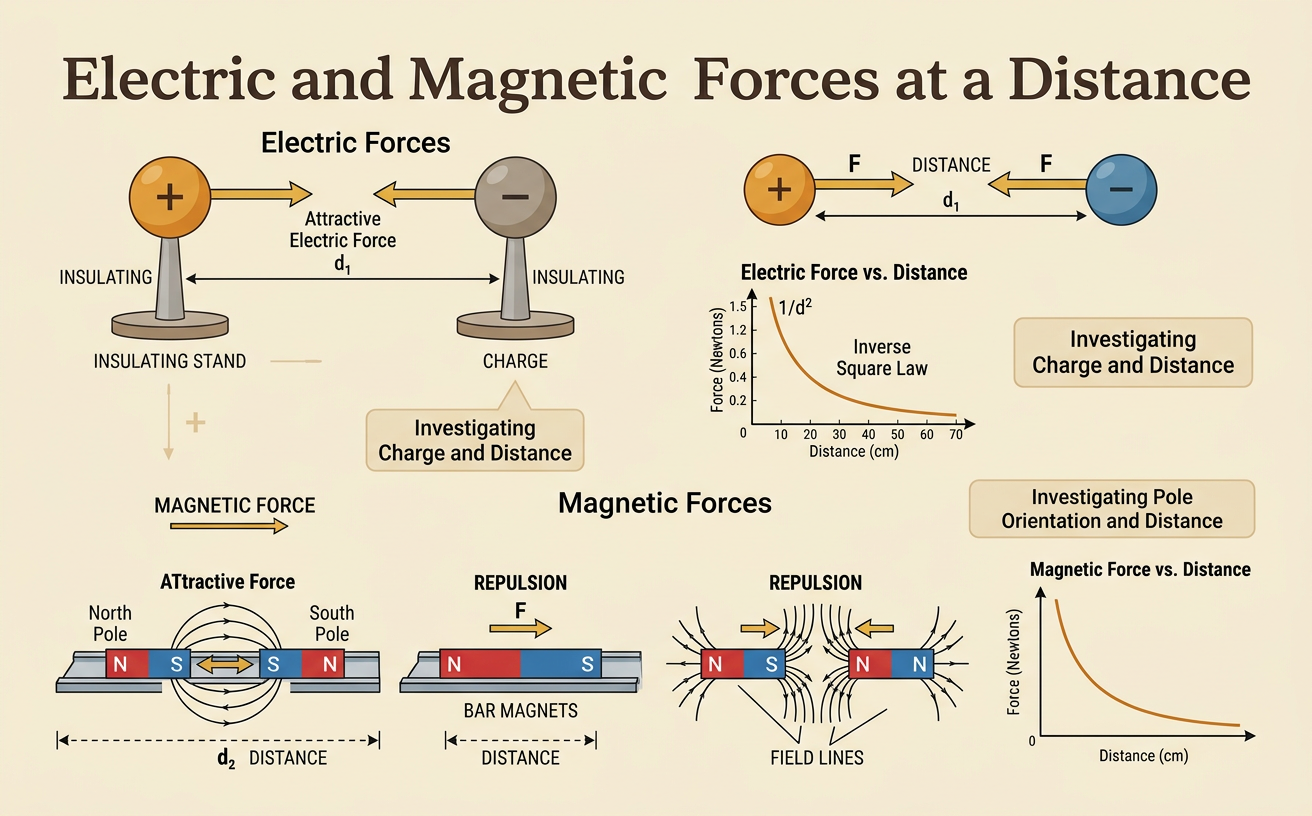
The direction of an electric or magnetic force depends on the objects being tested. Two objects with opposite electric charges attract, while objects with like charges repel. Magnets follow a similar pattern: opposite poles attract, and like poles repel. For example, the north pole of one bar magnet pulls toward the south pole of another, but two north poles push apart. A fair test changes only one factor at a time. Students can keep the same magnets and distance while reversing one magnet's orientation. They should record whether the magnets move together or apart. They can then ask, “How did pole orientation affect force direction?” Electric charge and magnetic poles are not the same thing, even though both systems can produce attraction and repulsion. Also, every bar magnet has both a north and a south pole.

Measuring Force at Different Distances
To investigate force strength, students can measure the force at several distances. They might secure one magnet to a force sensor and move a second magnet to measured positions. Distance should be measured consistently between the same reference points, such as the facing ends of the magnets. Students could test separations of 1, 2, 3, 4, and 5 centimeters while keeping magnet type, pole orientation, and alignment unchanged. At each distance, they record the force in newtons and repeat the measurement several times. The repeated values can be averaged to reduce the effect of small reading errors. A typical data set shows a stronger force at 1 centimeter than at 5 centimeters. Students should avoid letting the magnets touch because contact can change the setup and may exceed the sensor's range.

Graphing Patterns in the Data
A scatter plot helps students see how two measured variables are associated. Put distance in centimeters on the horizontal axis and force strength in newtons on the vertical axis. Plot one point for each distance and measured force pair. For example, points for a magnetic attraction test may fall rapidly as distance increases, showing that greater distance is associated with weaker force. The pattern may form a curve rather than a straight line. Students can describe its direction, shape, and strength without assuming that every point will fit perfectly. An unusual point may result from a shifted magnet, an incorrect distance reading, or normal measurement variation. Attraction and repulsion trials should be graphed separately or identified clearly with different symbols. The graph must include a title, labeled axes, units, and an appropriate numerical scale.

Making Evidence-Based Conclusions
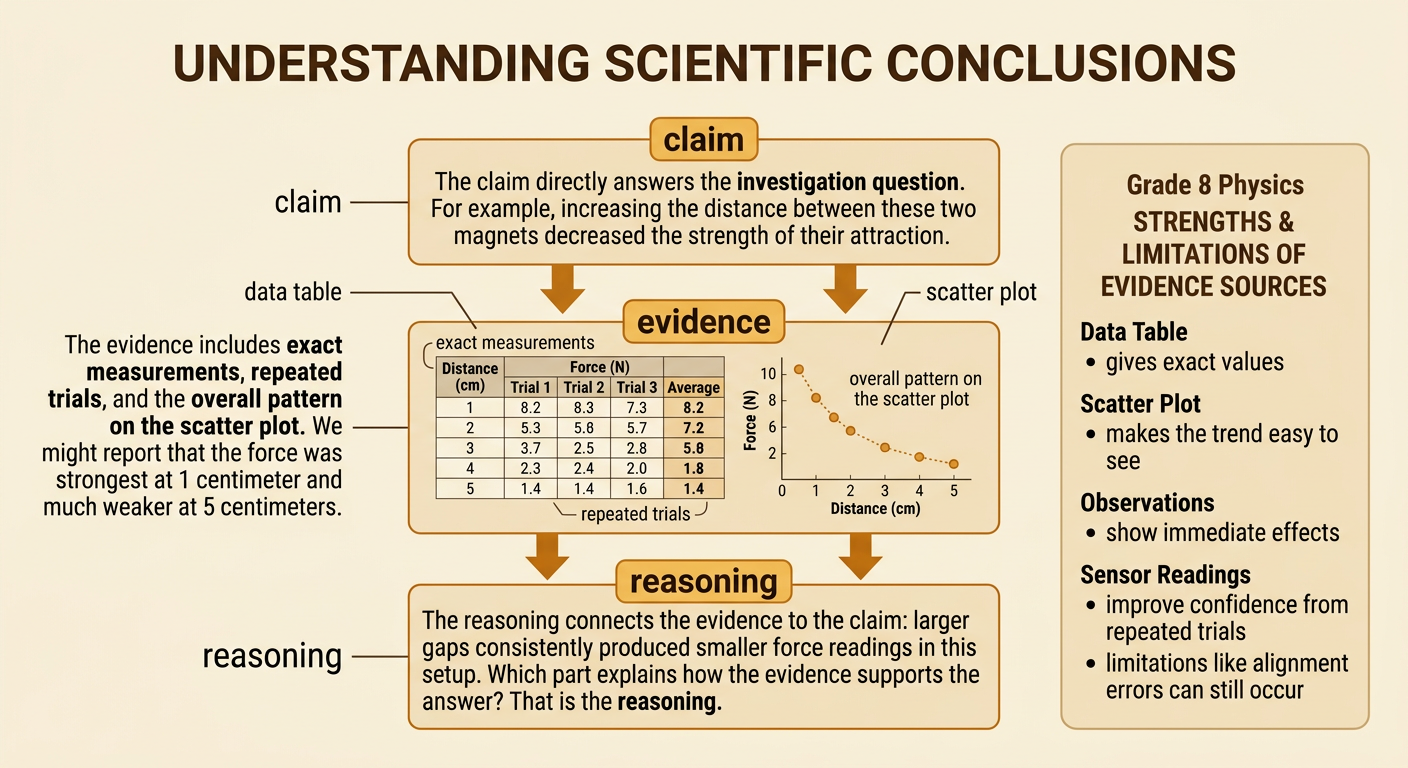
A strong scientific conclusion includes a claim, evidence, and reasoning. A claim might state, “Increasing the distance between these two magnets decreased the strength of their attraction.” Evidence should include specific measurements and the overall graph pattern. Reasoning explains why the evidence supports the claim: the tested magnets produced smaller force readings when the gap was larger. Students can strengthen the argument by comparing a data table, scatter plot, written observations, and repeated trials. Each source has strengths and limitations. A graph makes the pattern easy to see, but it may hide small differences. A table gives exact values, but the trend is less obvious. Sensor readings are quantitative, yet alignment errors can affect them. The conclusion should apply only to the tested setup unless further evidence supports a broader statement. New questions can address charge amount, magnet strength, or pole orientation.