
Encode a Community Map with Pixels
Students create a pixel-grid map of a familiar community place, encode its colored rows, and test whether a partner can accurately reconstruct the image from the code.
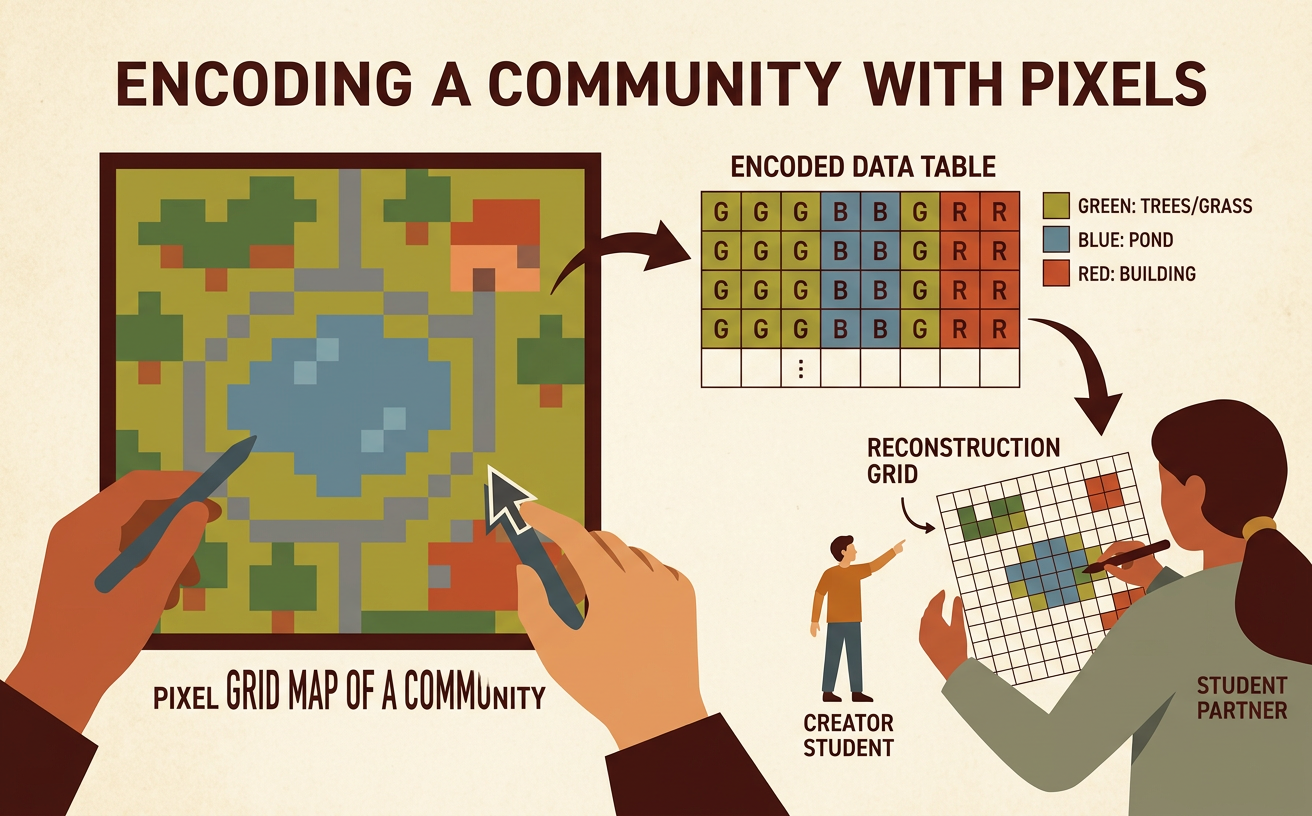
Illustrations are auto-generated and may be placeholders. They can be refreshed to match the narration.
Explore Pixels and Color Codes
A pixel is one small square of color in a digital picture. Many pixels placed in rows and columns can form a larger image. A color code uses a letter or symbol to name each color. For example, G can mean green, B can mean blue, and Y can mean yellow. Imagine a 4-by-4 grid showing a flower. One row might be G, Y, Y, G. That means the first square is green, the next two are yellow, and the last square is green. A color key helps everyone understand the code. Pixels must stay inside their squares, and each square gets only one color. Clear color codes allow another person to rebuild the same picture without seeing the original.

Choose a Familiar Community Place
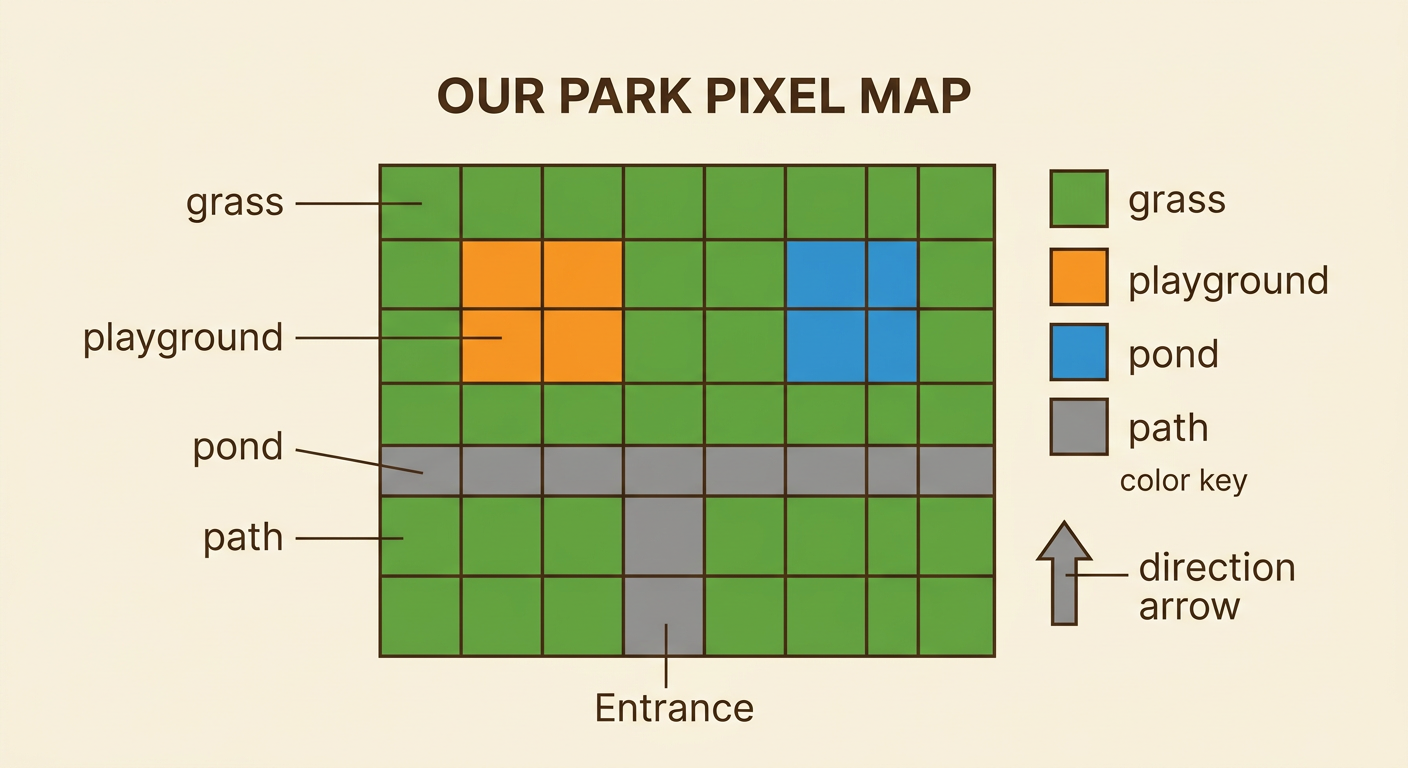
Choose a community place that you know, such as a park, school, library, fire station, or playground. Think about the most important features that help someone recognize and use the place. A map does not need every small detail. For example, a map of a neighborhood park might show a playground, a pond, a walking path, grass, and an entrance. Decide which features must be included and which can be left out. Your criteria might be that the map shows the entrance and three important features. Your constraint might be that the map must fit on a 6-by-6 grid and use only four colors. Sketch two possible arrangements, compare them, and choose the one that communicates the place most clearly.

Create a Pixel-Grid Map
Draw a square grid, then turn your chosen place into a pixel map. Begin with the largest areas and add smaller features afterward. Each square must have one color. For a 6-by-6 park map, green can represent grass, orange can represent the playground, blue can represent the pond, and gray can represent paths. The top two middle-left squares might form the playground, while four blue squares at the upper right form the pond. A full gray row can show a path across the park, and a gray column can connect it to the entrance at the bottom. Add a map title, a color key, and a direction arrow. These visual details help viewers understand what the pixels represent and where features are located.
Encode the Map Row by Row
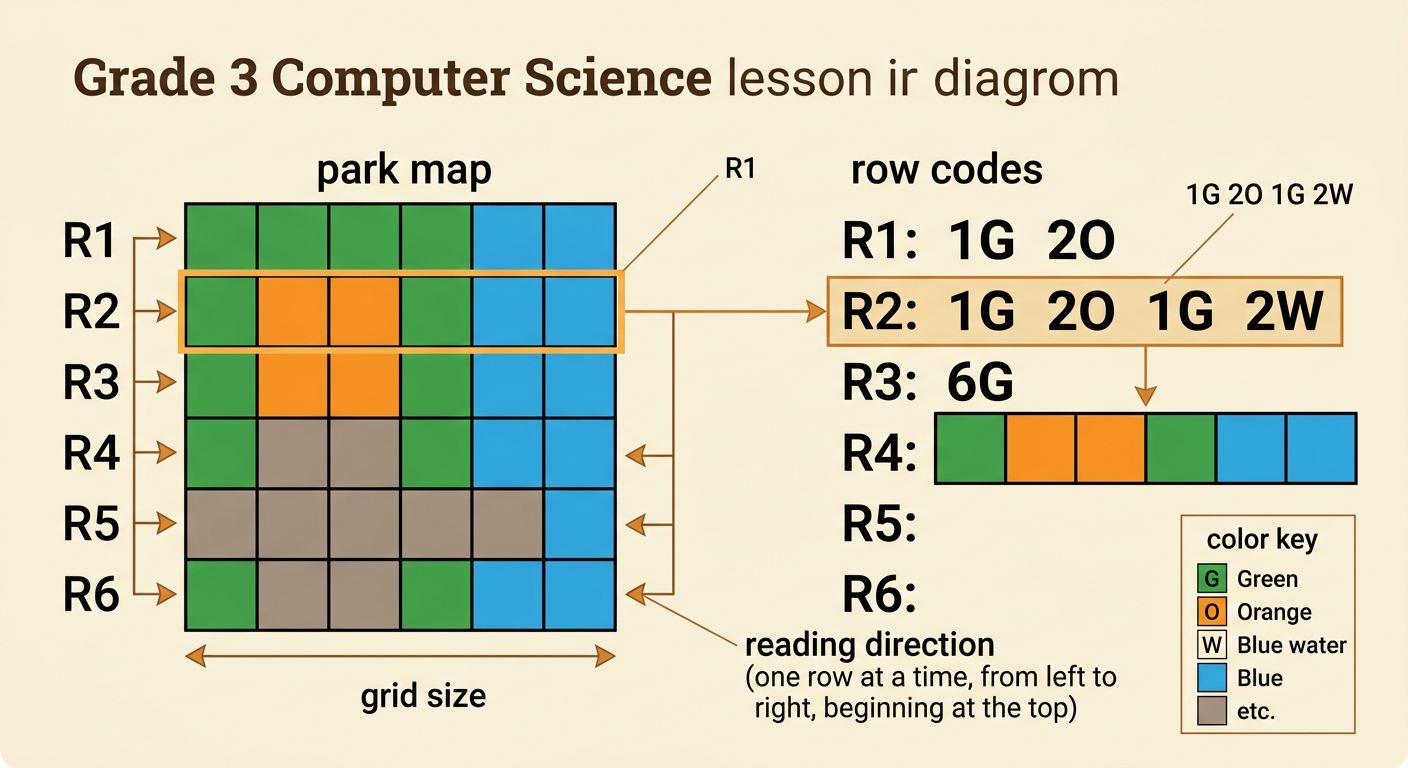
To encode your map, read each row from left to right, starting with the top row. Record the color letters in the same order. You may shorten repeated colors with a number. For example, 6G means six green pixels. Using G for green, O for orange, W for blue water, and P for gray path, the park’s second row can be written 1G 2O 1G 2W. This expands to G, O, O, G, W, W. Label every row so none are skipped: R1, R2, R3, and so on. Include the grid size, reading direction, and color key with your code. Check that each decoded row contains exactly six pixels. Precise directions make the code easier for another person to follow.
Decode and Rebuild a Partner’s Map
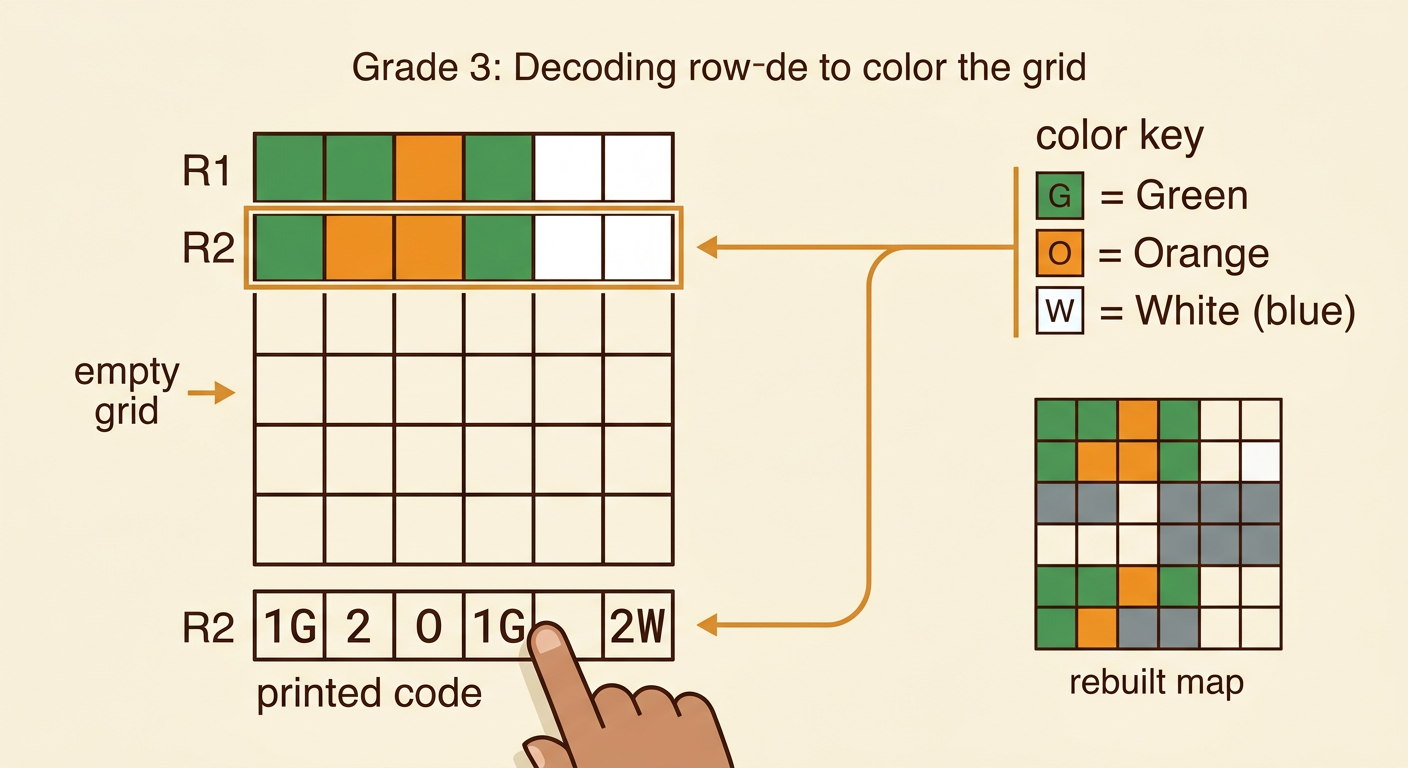
Exchange only your code and color key with a partner. Do not show the original map yet. First, check the grid size and draw an empty grid. Decode one row at a time, beginning with R1. If the code says R2: 1G 2O 1G 2W, color one green square, two orange squares, one green square, and two blue squares. Count the squares before moving to the next row. Ask for clarification if a letter is missing from the key or if a row has too many pixels, but do not guess what the original picture looks like. When all rows are complete, add the title and direction arrow if they were included in the directions. The rebuilt image tests whether the code communicates the map accurately.
Compare Accuracy and Improve the Code
Place the original map beside the rebuilt map and compare corresponding squares. Count a match when both squares have the same color in the same location. For example, if 34 of 36 pixels match, the code was mostly successful, but two squares need investigation. Circle the mismatches and find the cause. The encoder may have skipped a letter, used an unclear symbol, or written the wrong number. Compare possible improvements, such as listing every color letter or using numbers for repeated colors. Choose the solution that is both accurate and easy to read. Revise the code, then ask your partner to correct or rebuild the affected rows. Explain how the title, color key, grid, and coded rows work together as visual displays of a community place.
