Energy Changes in Chemical Reactions
Students use bond-energy models and reaction-energy diagrams to distinguish exothermic and endothermic reactions and connect energy changes to practical fuel choices.

Illustrations are auto-generated and may be placeholders. They can be refreshed to match the narration.
Chemical Bonds and Stored Energy
Chemical energy is potential energy associated with the arrangement of atoms and electrons. A chemical bond does not release energy when it is broken; breaking any bond requires an energy input. When atoms form a new bond, energy is released as the system moves to a more stable, lower-energy arrangement. Therefore, a reaction’s overall energy change depends on the difference between the energy absorbed to break reactant bonds and the energy released when product bonds form. For example, hydrogen and chlorine molecules must first absorb energy to break their H–H and Cl–Cl bonds. When H–Cl bonds form in hydrogen chloride, more energy is released than was absorbed. The reaction therefore transfers energy to the surroundings. Bond-energy models help track these changes even though they simplify the complex behavior of electrons.

Exothermic vs. Endothermic Reactions
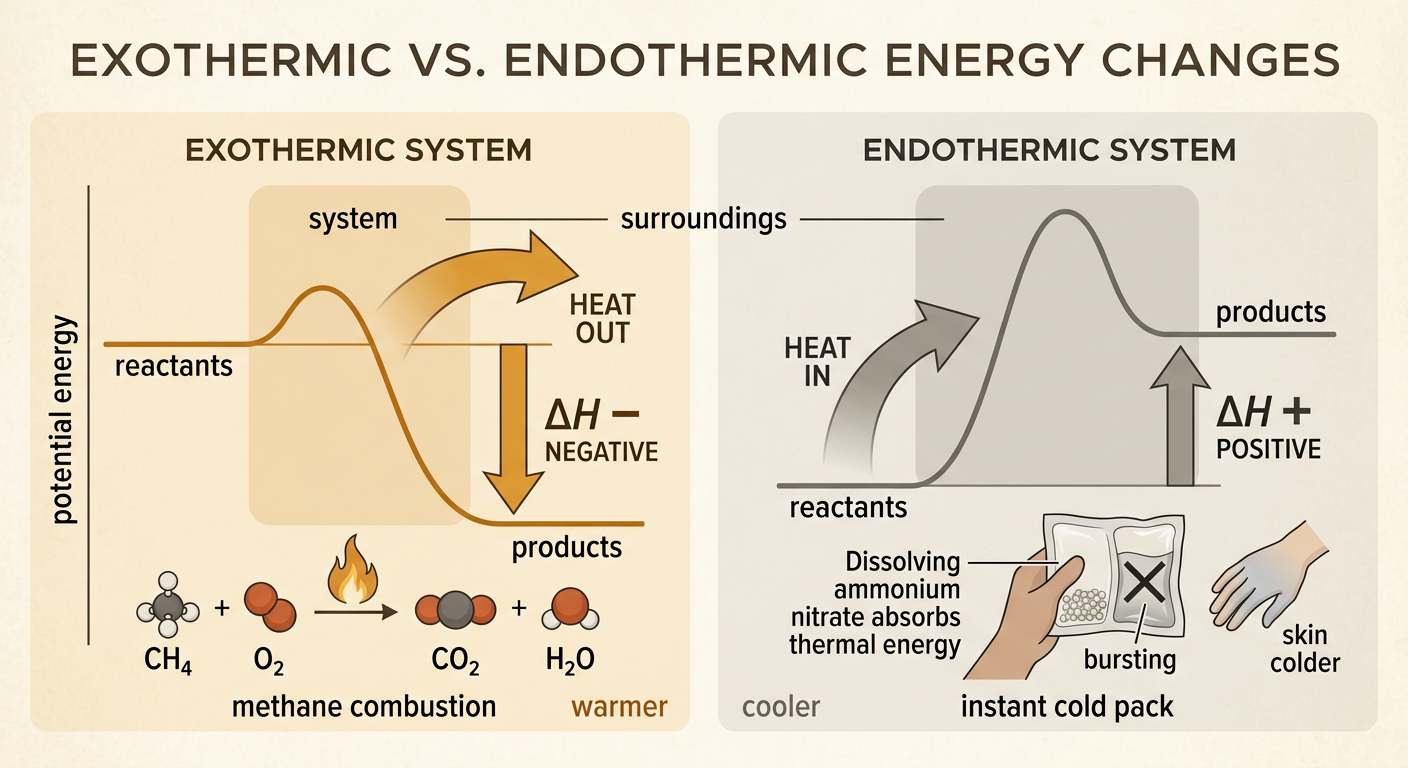
An exothermic reaction releases more energy during bond formation than it absorbs during bond breaking. Energy flows from the reacting system to the surroundings, often making the surroundings warmer. Its energy change, ΔH, is negative because the products have less chemical potential energy than the reactants. Methane combustion is exothermic: methane reacts with oxygen to form carbon dioxide and water while releasing heat. An endothermic reaction absorbs more energy than it releases, so energy flows from the surroundings into the system. Its ΔH is positive, and the products have more chemical potential energy than the reactants. In some instant cold packs, dissolving ammonium nitrate is an endothermic process that absorbs thermal energy from the pack and nearby skin. Temperature change is useful evidence, but determining energy flow requires identifying the system and surroundings.
Reading Reaction-Energy Diagrams
A reaction-energy diagram shows how the potential energy of a chemical system changes as a reaction proceeds. The vertical axis represents potential energy, and the horizontal axis represents reaction progress rather than clock time. The curve rises from the reactants to a peak because energy is required to distort and break bonds. The difference between the reactant level and the peak is the activation energy. After the peak, the curve falls as product bonds form. In an exothermic methane-combustion diagram, the products lie below the reactants, so ΔH is negative. In an endothermic diagram, the products lie above the reactants. A catalyst provides a different pathway with lower activation energy, but it does not change the reactant level, product level, or ΔH. The vertical difference between reactants and products represents the net energy change.

Calculating Net Energy Change
Average bond energies can be used to estimate a reaction’s net energy change. First, add the energies required to break all bonds in the reactants. Next, add the energies released when all bonds in the products form. Use the relationship ΔH ≈ total bond energy broken minus total bond energy formed. For H₂ + Cl₂ → 2HCl, breaking one H–H bond requires 436 kilojoules per mole, and breaking one Cl–Cl bond requires 243 kilojoules per mole. The total absorbed is 679 kilojoules. Forming two H–Cl bonds releases 2 × 431, or 862 kilojoules. Thus, ΔH ≈ 679 − 862 = −183 kilojoules for the reaction as written. The negative result predicts an exothermic reaction. Because tabulated bond energies are averages, this calculation is an estimate rather than an exact measured value.

Comparing Fuels and Energy Trade-Offs
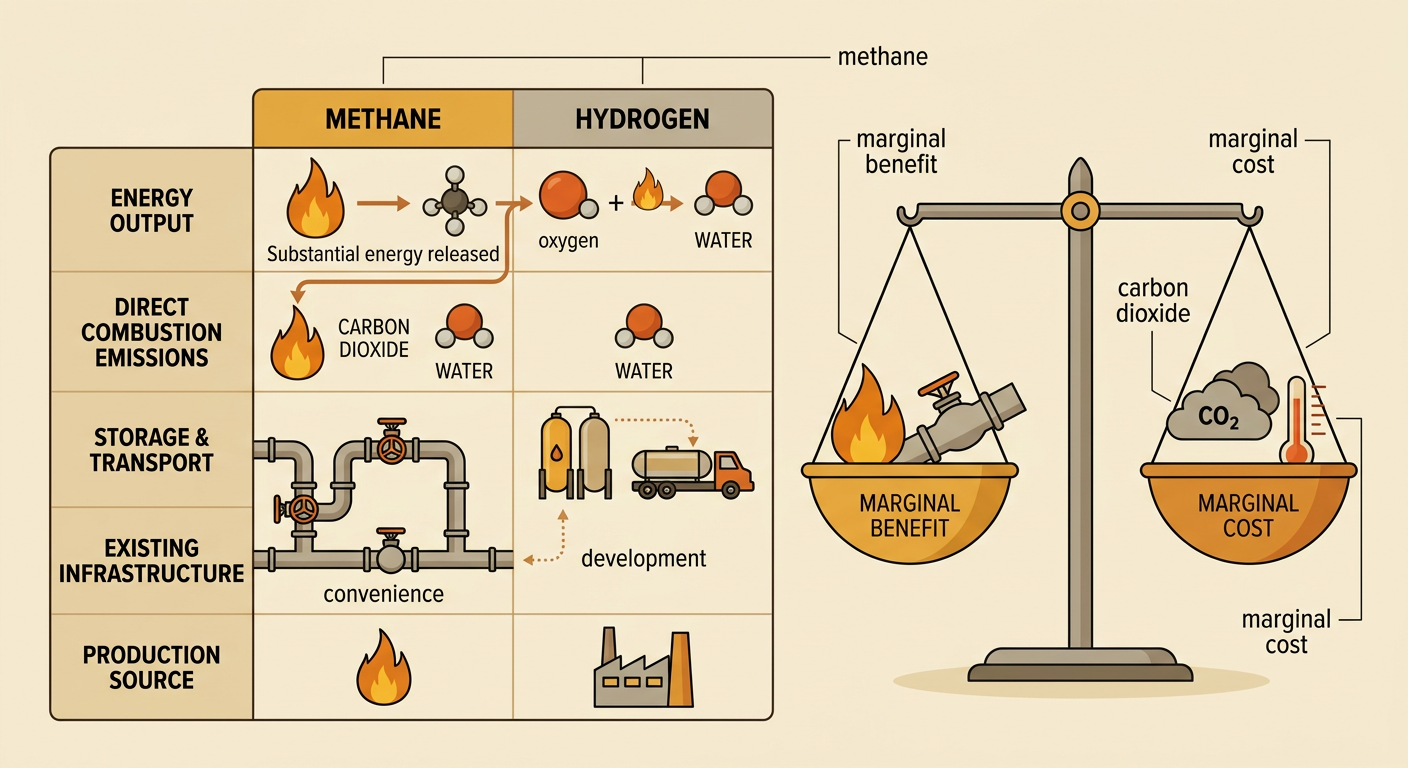
Fuel choices involve scientific, environmental, and economic trade-offs. Useful comparisons include energy released per unit mass, storage needs, price, availability, safety, infrastructure, and pollution. Methane provides substantial energy and is easy to distribute through existing pipelines, which creates a marginal benefit for each additional unit used. However, burning methane produces carbon dioxide, and methane leaks can contribute strongly to warming, creating marginal environmental and social costs. Hydrogen releases energy when it reacts with oxygen and produces water without direct carbon dioxide emissions. Its overall impact depends on how the hydrogen is produced, compressed, transported, and stored. A decision-maker can compare the marginal benefit of one more unit of usable energy with the marginal cost of obtaining and using that unit. No fuel is automatically best for every purpose; the preferred choice depends on evidence, priorities, technology, and local conditions.