Energy Transfer Through Food Webs
Students model how energy decreases across trophic levels and analyze how changes in human and natural systems can disrupt a food web.
Illustrations are auto-generated and may be placeholders. They can be refreshed to match the narration.
Producers, Consumers, and Decomposers
Organisms in an ecosystem have different roles in transferring energy and cycling matter. Producers, such as grasses and algae, capture sunlight and store some of its energy in sugars through photosynthesis. Consumers obtain chemical energy by eating producers or other consumers. For example, a grasshopper eats grass, a frog eats the grasshopper, and a snake may eat the frog. Decomposers, including many fungi and bacteria, break down dead organisms and wastes. This process returns nutrients to soil or water, where producers can use them again. Energy does not cycle in the same way as matter. At each step, organisms use energy for life processes, and much of it eventually leaves the ecosystem as heat. Decomposers receive matter and energy from organisms at every feeding level.

Tracing Energy Through a Food Web
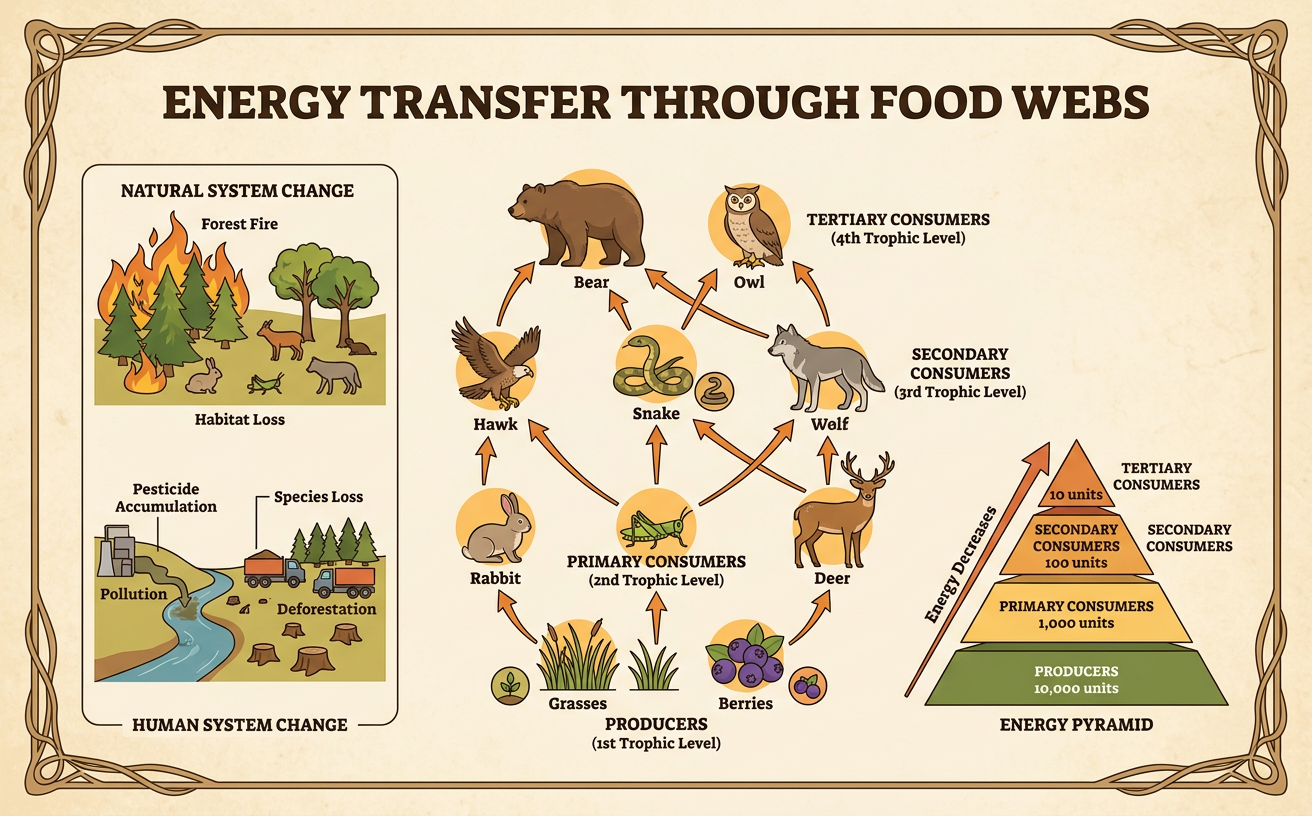
A food web combines several connected food chains to show multiple feeding relationships. Arrows point from the organism being eaten toward the organism that receives its energy. In a meadow, grass may provide energy to rabbits, mice, and grasshoppers. A hawk may eat rabbits and mice, while a snake may eat mice and frogs. Because many organisms have more than one food source, energy can follow several paths through the same ecosystem. One path might be Sun to grass to mouse to hawk. Another could be Sun to grass to grasshopper to frog to snake. A food web is more realistic than a single food chain, but it does not show the exact amount of energy transferred unless values are added. Tracing arrows helps students translate written descriptions of feeding into a visual model.

The Ten Percent Energy Transfer Pattern
Only a fraction of the energy available at one trophic level becomes biomass at the next level. A common model estimates this transfer at about 10 percent. If producers store 20,000 kilojoules of energy, primary consumers may store about 2,000 kilojoules, secondary consumers about 200 kilojoules, and tertiary consumers about 20 kilojoules. The remaining energy is not simply destroyed. Organisms use much of it for movement, growth, repair, and other cellular processes, and energy is released as heat. Some biomass is also not eaten or digested and may be used by decomposers. The 10 percent value is a useful pattern, not an exact rule for every ecosystem. It supports the claim that less usable energy is available at higher trophic levels, which helps explain why ecosystems usually support fewer top predators than producers.

Building an Energy Pyramid
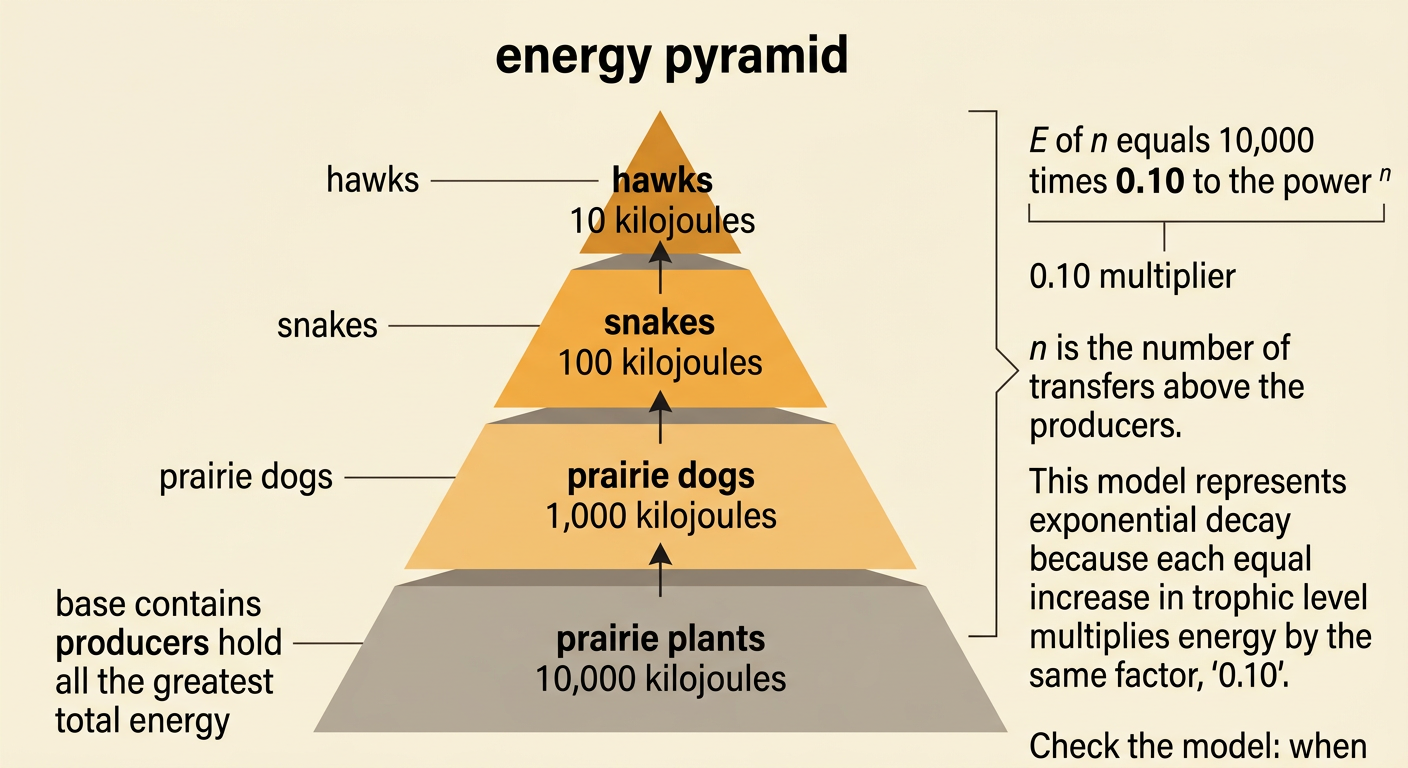
An energy pyramid represents the amount of energy available at successive trophic levels. Producers form the wide base because they contain the greatest total energy. Primary, secondary, and tertiary consumers occupy increasingly smaller levels above them. Suppose prairie plants store 10,000 kilojoules, prairie dogs store 1,000 kilojoules, snakes store 100 kilojoules, and hawks store 10 kilojoules. With a constant 10 percent transfer, the relationship can be modeled by E(n) = 10,000(0.10)^n, where n is the number of transfers above the producers. This is exponential decay because equal increases in trophic level multiply the available energy by the same factor, 0.10. The pyramid’s area is a visual comparison, while the equation and energy values provide a mathematical representation that can support conclusions about energy flow.
Predicting the Effects of Food-Web Disruptions
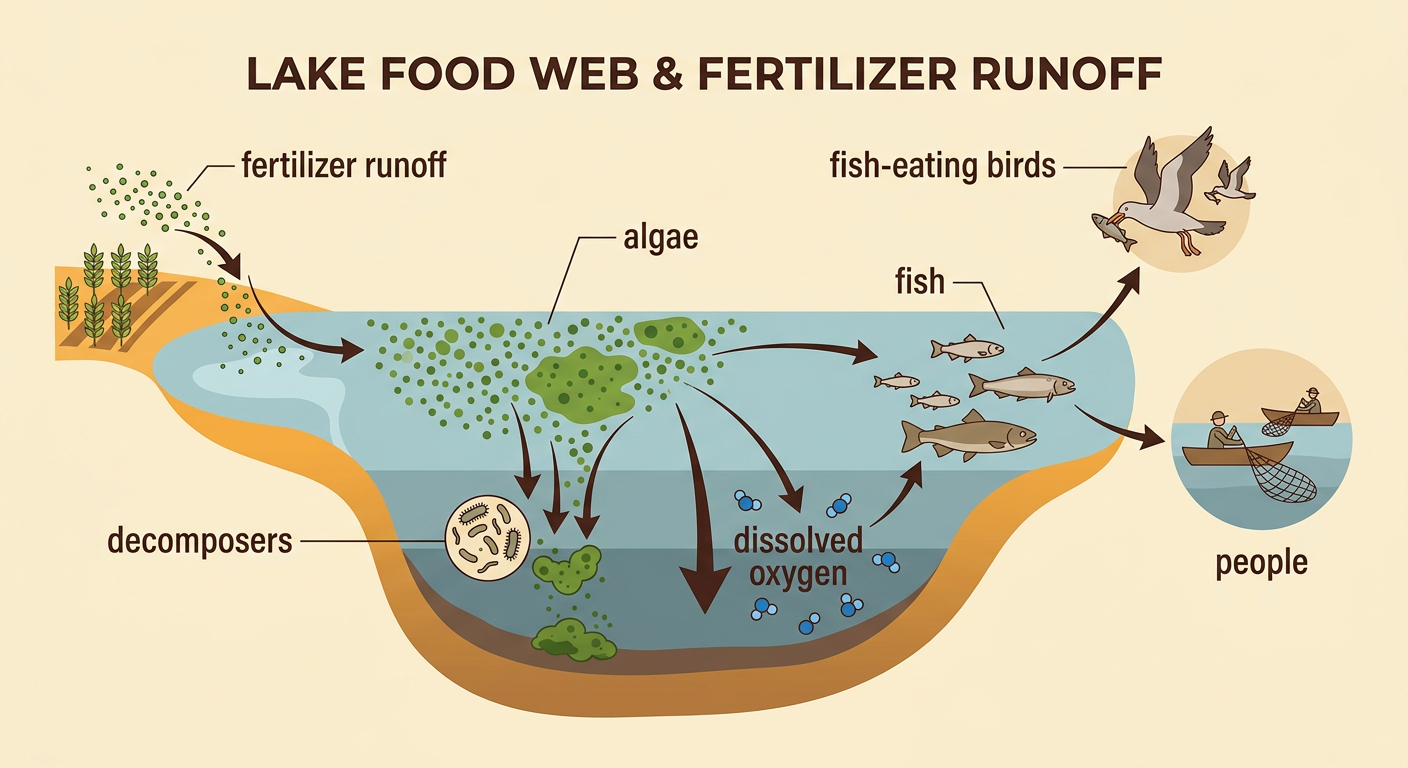
A change in one population or physical condition can spread through an entire food web. Consider a lake where algae support insect larvae, small fish eat the larvae, and larger fish eat the small fish. Fertilizer runoff from farms can cause rapid algal growth. When excess algae die, decomposers consume them and use dissolved oxygen during cellular respiration. Low oxygen can kill fish, reducing food for fish-eating birds and lowering catches for people. This example shows reciprocal interactions: human land use changes water conditions, and the altered lake affects local recreation, food supplies, and jobs. Natural events can also cause disruptions. A drought may reduce water and producer growth, leaving less energy for every higher trophic level. To make a prediction, identify the initial change, follow feeding arrows, consider indirect effects and decomposers, and support the claim with evidence such as population or energy data.