
Eutrophication: When Nutrients Overload Aquatic Ecosystems
Students interpret oxygen, nutrient, and algal-growth data to explain eutrophication and evaluate strategies for reducing harmful runoff into aquatic ecosystems.

Illustrations are auto-generated and may be placeholders. They can be refreshed to match the narration.
Nutrients in Aquatic Ecosystems
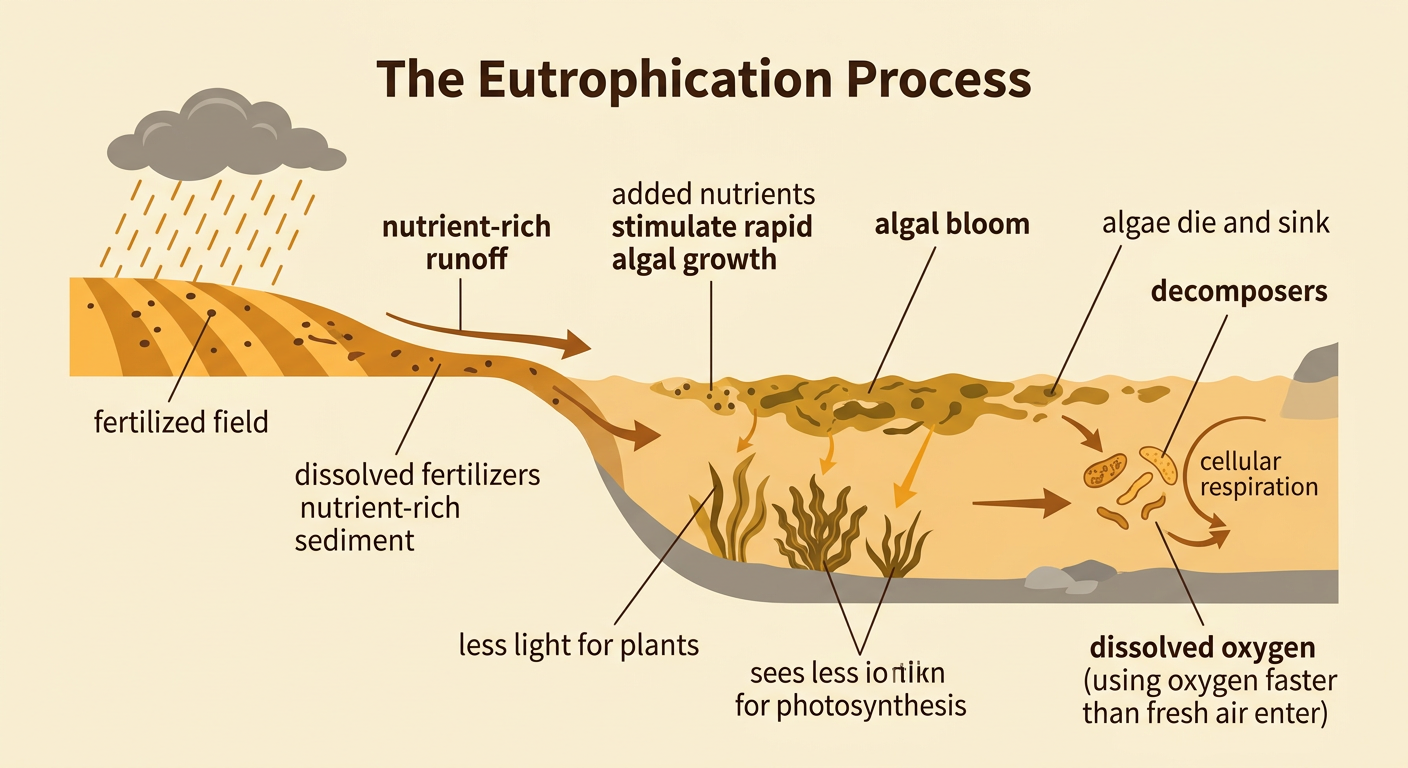
Aquatic ecosystems need nutrients such as nitrogen and phosphorus because algae and aquatic plants use them to build proteins, DNA, and cells. In balanced amounts, these nutrients support food webs. Excess nutrients, however, can disrupt ecosystem stability. Phosphorus often limits algal growth in freshwater lakes, while nitrogen frequently limits growth in coastal waters. Human activities can add unusually large nutrient loads through fertilizer runoff, animal waste, sewage, and stormwater. For example, heavy rain may wash phosphorus-rich soil from a fertilized cornfield into a nearby lake. Algae then receive more phosphorus than the lake normally supplies, allowing some species to multiply rapidly. The ecological effect depends on the nutrient amount, timing, water temperature, flow, and ability of the water body to flush out pollutants.

From Runoff to Algal Bloom
Eutrophication is the enrichment of water with nutrients, especially nitrogen and phosphorus. The process often begins when rain or irrigation carries dissolved fertilizer and nutrient-rich sediment into streams, lakes, or estuaries. Increased nutrients stimulate rapid algal growth, producing an algal bloom. Blooms can reduce water clarity and shade underwater plants, limiting photosynthesis below the surface. Some cyanobacterial blooms also release toxins, although not every algal bloom is toxic. As algae die, bacteria and other decomposers break down their organic matter. Decomposition requires cellular respiration, which consumes dissolved oxygen. For example, runoff entering a warm, slow-moving reservoir after a storm may produce a surface bloom within days. Later, bacterial decomposition can lower oxygen concentrations, placing fish and bottom-dwelling organisms under stress.
Interpreting Nutrient and Oxygen Data
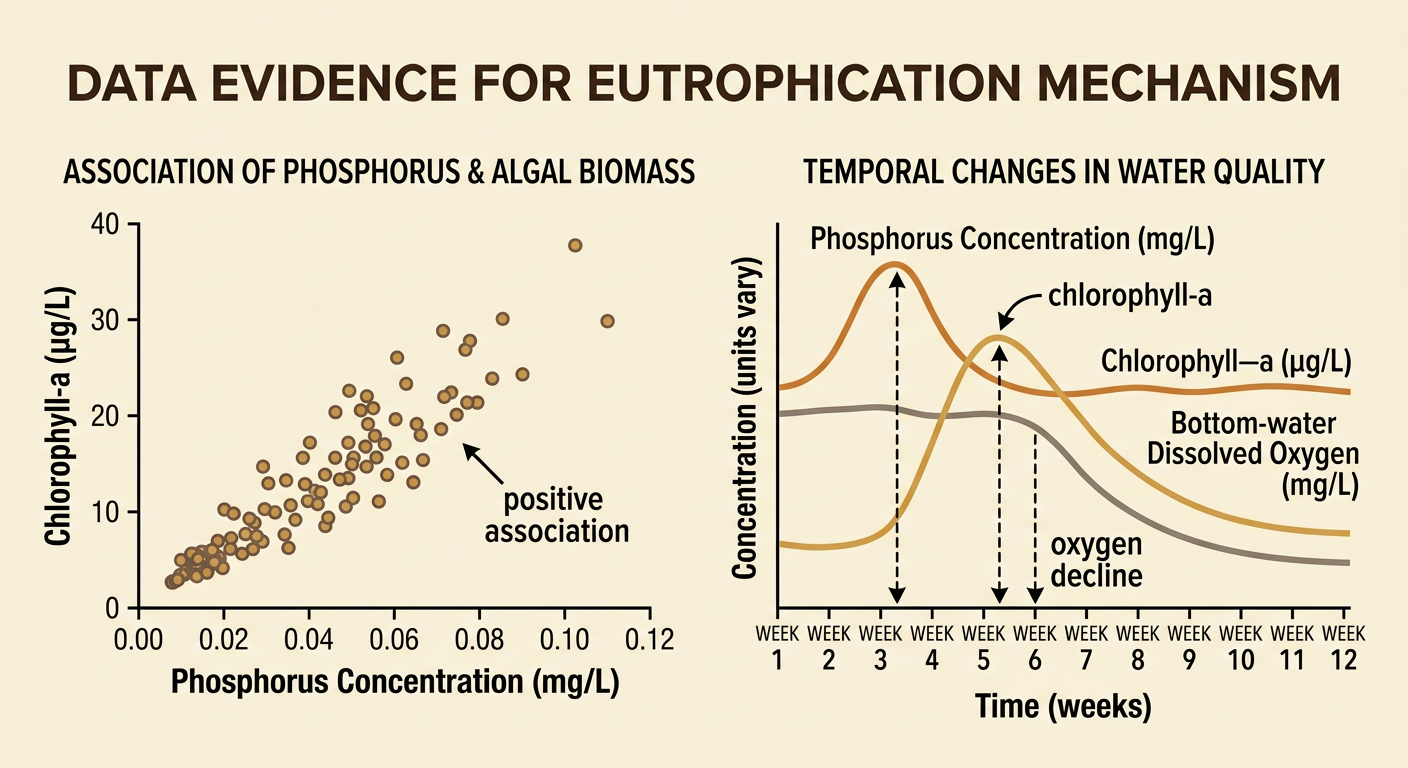
Scientists identify eutrophication by comparing several kinds of evidence rather than relying on water color alone. Nutrient concentration, chlorophyll-a, water clarity, temperature, and dissolved oxygen reveal different parts of the process. Consider monthly lake data: phosphorus rises from 0.02 to 0.10 milligrams per liter after spring runoff, while chlorophyll-a rises from 5 to 35 micrograms per liter. This positive association supports the claim that greater nutrient availability is related to greater algal biomass. Two weeks later, bottom-water oxygen falls from 8 to 3 milligrams per liter. A scatterplot of phosphorus and chlorophyll-a can show their relationship, while a time-series graph can reveal the delayed oxygen decline. Correlation alone does not prove causation, so scientists also examine rainfall, temperature, streamflow, and land-use data for alternative explanations.
Explaining Aquatic Dead Zones
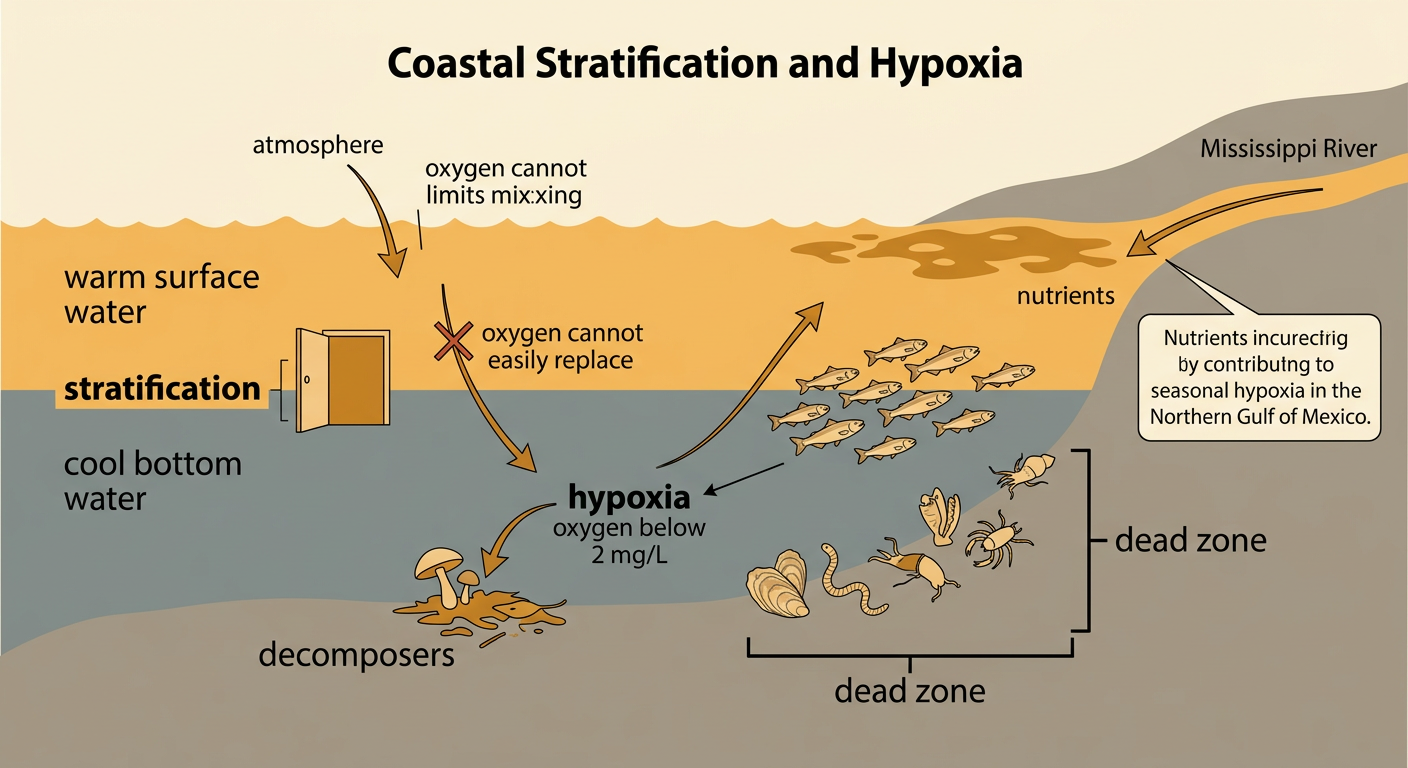
A dead zone is an area where dissolved oxygen becomes too low to support many aquatic animals. Hypoxia is commonly defined as oxygen below 2 milligrams per liter, although species differ in tolerance. Dead zones often form when nutrient-driven blooms create large amounts of organic matter for decomposers. They become more severe when warm surface water remains above cooler, denser bottom water. This stratification limits mixing, so oxygen from the atmosphere does not easily replace oxygen consumed at depth. Mobile fish may leave, but oysters, worms, and other slow-moving or attached organisms may die. For example, nutrient loads carried by the Mississippi River contribute to seasonal hypoxia in the northern Gulf of Mexico. Calling the area “dead” does not mean all life disappears; it means oxygen conditions greatly reduce biodiversity and usable habitat.
Evaluating Runoff Solutions
An effective runoff plan reduces nutrients at their sources and along their pathways while considering cost, feasibility, fairness, and local geography. Farmers can apply fertilizer at the correct rate and time, plant cover crops, restore wetlands, or maintain vegetated stream buffers. Cities can upgrade wastewater treatment, repair sewer systems, and install rain gardens or permeable pavement. For example, a 20-meter stream buffer may trap sediment and absorb nutrients before runoff reaches a river, but it also removes some land from crop production. A wetland can store water and improve wildlife habitat, yet it requires suitable land and long-term maintenance. Students can evaluate options by comparing nutrient reduction, cost per kilogram removed, time required, and effects on communities. The strongest design may combine regulations, financial incentives, monitoring, and adaptive changes based on measured results.
