Evaluating Bias in a Simple Classification Algorithm
Students analyze model results across demographic groups, calculate error rates, and use evidence to recommend changes that improve algorithmic fairness.

Illustrations are auto-generated and may be placeholders. They can be refreshed to match the narration.
How Classification Algorithms Make Decisions
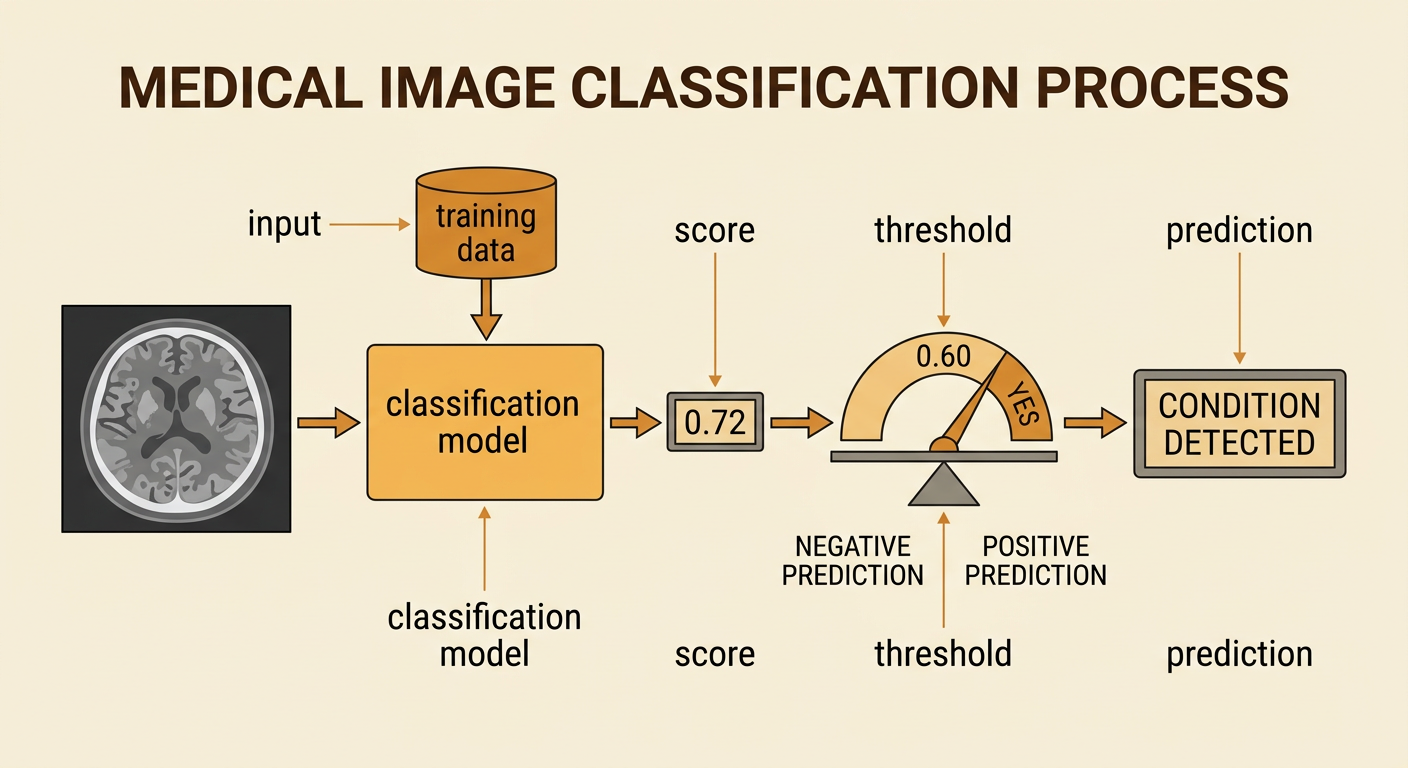
A classification algorithm assigns an input to a category, such as “condition detected” or “condition not detected.” It learns patterns from training examples containing features and known labels. For example, a medical screening model might analyze measurements from an image and produce a score from 0 to 1. If the score is at least 0.60, the model predicts that the condition is present. Otherwise, it predicts that the condition is absent. The threshold converts a numerical score into a category. However, the model does not understand health in the way a doctor does. Its prediction depends on the examples, features, and labels used during development. If the training data underrepresent patients with darker skin tones, the learned relationship between image features and outcomes may be less accurate for that group.
Reviewing Predictions and Outcomes
To evaluate a classifier, compare each prediction with a confirmed outcome. A true positive occurs when the model predicts a condition and testing confirms it. A true negative occurs when the model predicts no condition and testing confirms no condition. A false positive is an incorrect alert, while a false negative is a missed case. Suppose 100 lighter-skin patients include 20 confirmed positive cases and 80 confirmed negative cases. The model produces 18 true positives, 2 false negatives, 8 false positives, and 72 true negatives. For 100 darker-skin patients with the same outcome totals, it produces 12 true positives, 8 false negatives, 4 false positives, and 76 true negatives. Organizing these results in confusion matrices makes the model’s successes and errors visible before rates are calculated.

Calculating Group Error Rates
Raw error counts become more meaningful when converted into rates with appropriate denominators. The false negative rate equals false negatives divided by all confirmed positive cases. For lighter-skin patients, it is 2 divided by 20, or 10%. For darker-skin patients, it is 8 divided by 20, or 40%. The false positive rate equals false positives divided by all confirmed negative cases. It is 8 divided by 80, or 10%, for the lighter-skin group and 4 divided by 80, or 5%, for the darker-skin group. Overall error rate uses all cases: the lighter-skin group has 10 errors out of 100, while the darker-skin group has 12 errors out of 100. Comparing several rates is essential because similar overall accuracy can hide large differences in particular kinds of harm.

Identifying Bias and Trade-Offs
A model shows a fairness concern when its errors create unequal risks across groups, especially when those errors affect important opportunities, safety, or health. In this example, the darker-skin group’s 40% false negative rate is four times the lighter-skin group’s 10% rate. That difference suggests the screening system is much more likely to miss the condition for darker-skin patients. Lowering the decision threshold might detect more positive cases and reduce false negatives, but it could also increase false positives and lead to unnecessary follow-up tests. Raising the threshold could reduce false alarms while missing more real cases. Designers must prioritize criteria such as patient safety, equal performance, cost, and access to follow-up care. They should also examine training data and measurement quality because changing only the threshold may not correct the underlying source of unequal performance.

Writing an Evidence-Based Recommendation
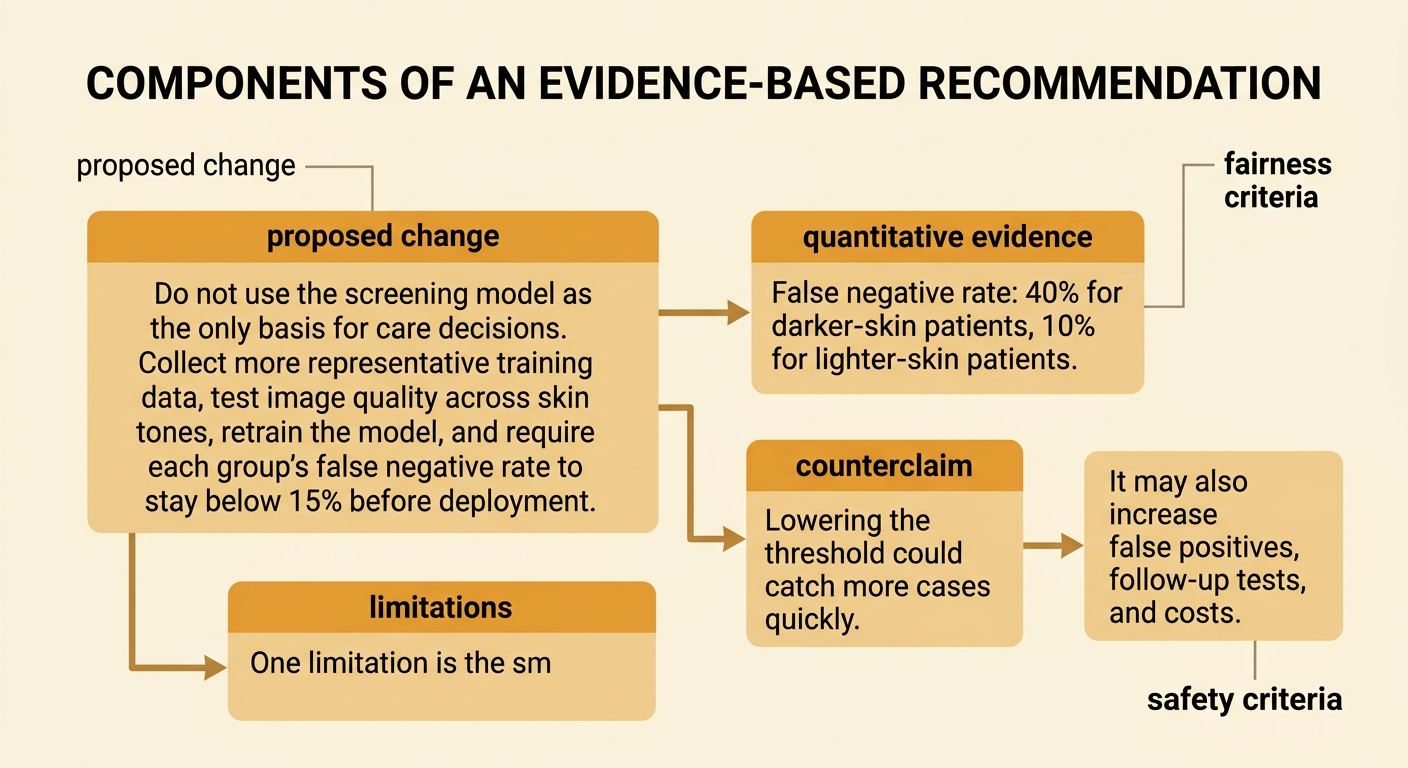
An evidence-based recommendation states a proposed change, supports it with quantitative results, and acknowledges limitations and counterclaims. A strong recommendation might say: “Do not use the screening model as the only basis for care decisions. Collect more representative training data, test image quality across skin tones, retrain the model, and require the false negative rate for each group to remain below 15% before deployment.” The evidence is that the current false negative rates are 40% for darker-skin patients and 10% for lighter-skin patients. A counterclaim is that lowering the threshold could catch more cases quickly, but this may increase false positives and costs. A weakness in the analysis is the small sample of 100 patients per group. The revised model should therefore be evaluated on a larger, independent data set using both fairness and safety criteria.