
Evaluating Bias in Algorithmic Decision Systems
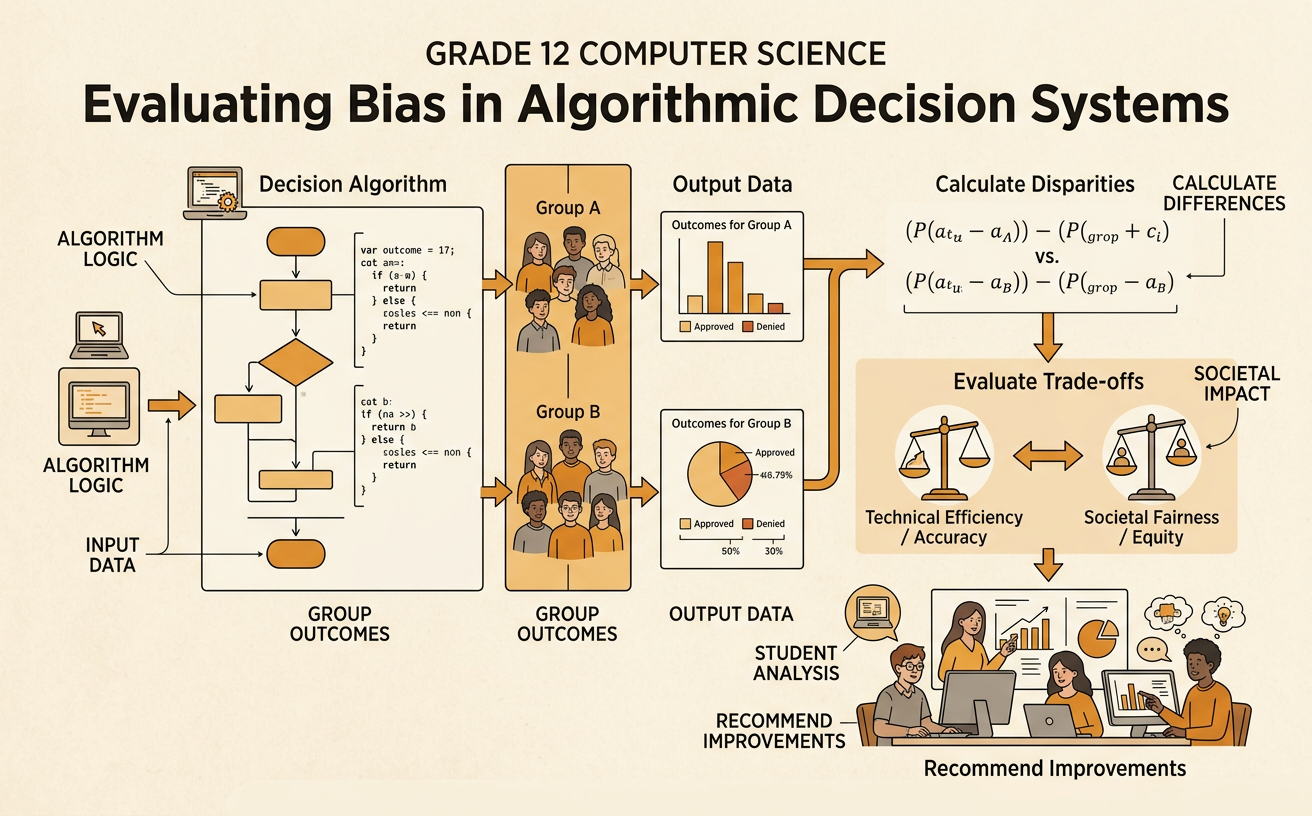
Students analyze the outputs of a simplified decision algorithm, calculate differences in outcomes across groups, and evaluate technical and societal trade-offs before recommending improvements.
Illustrations are auto-generated and may be placeholders. They can be refreshed to match the narration.
How Decision Algorithms Work
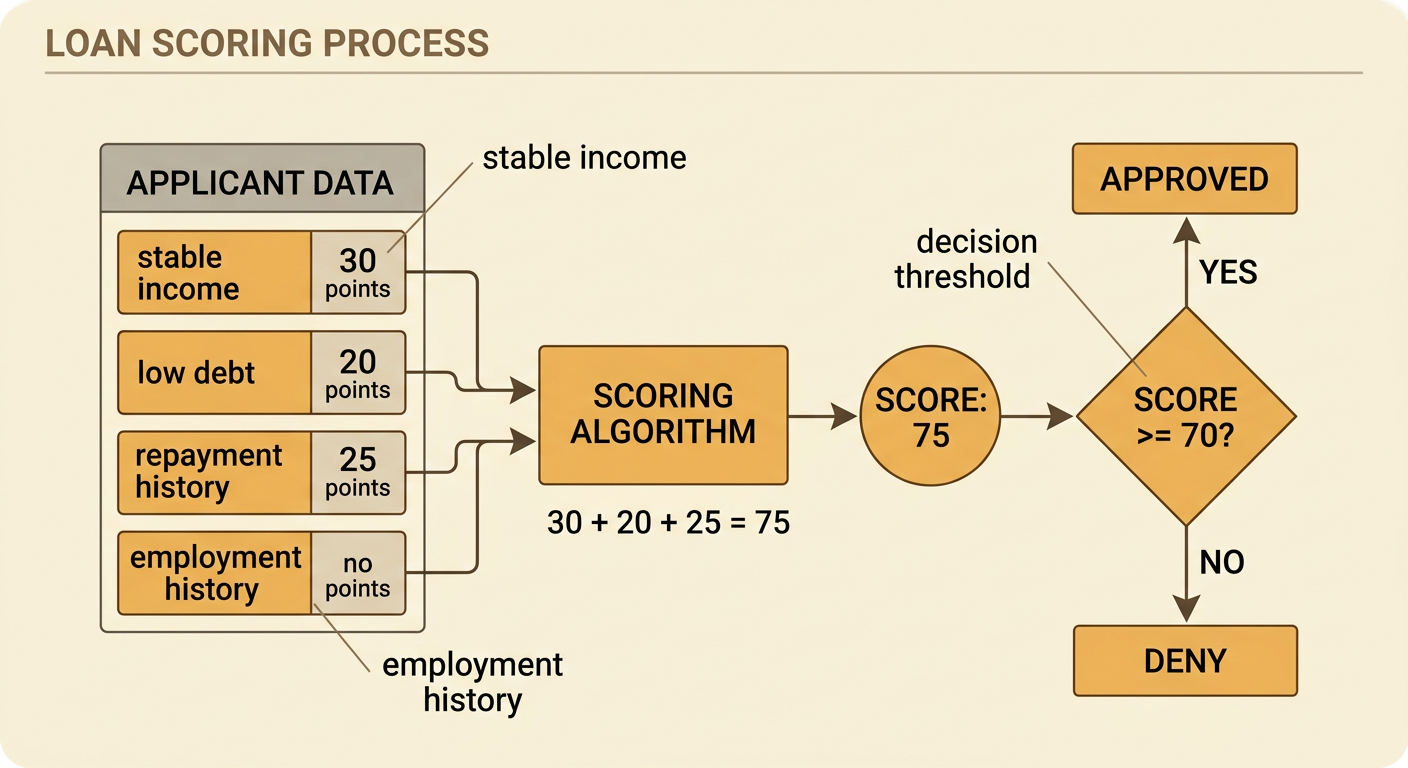
A decision algorithm follows programmed rules to turn input data into an output, such as approve, deny, rank, or review. A simplified loan algorithm might assign points for income, debt level, employment history, and past repayment. It could approve applicants whose scores reach 70 and deny those below 70. For example, an applicant might receive 30 points for stable income, 20 for low debt, and 25 for repayment history, producing a score of 75 and an approval. Although this process appears objective, people choose the inputs, point values, training data, and decision threshold. Historical data may contain patterns created by unequal access to jobs, housing, or credit. Therefore, evaluating an algorithm requires examining both how it operates and how its decisions affect people.
Reviewing Outcomes by Group
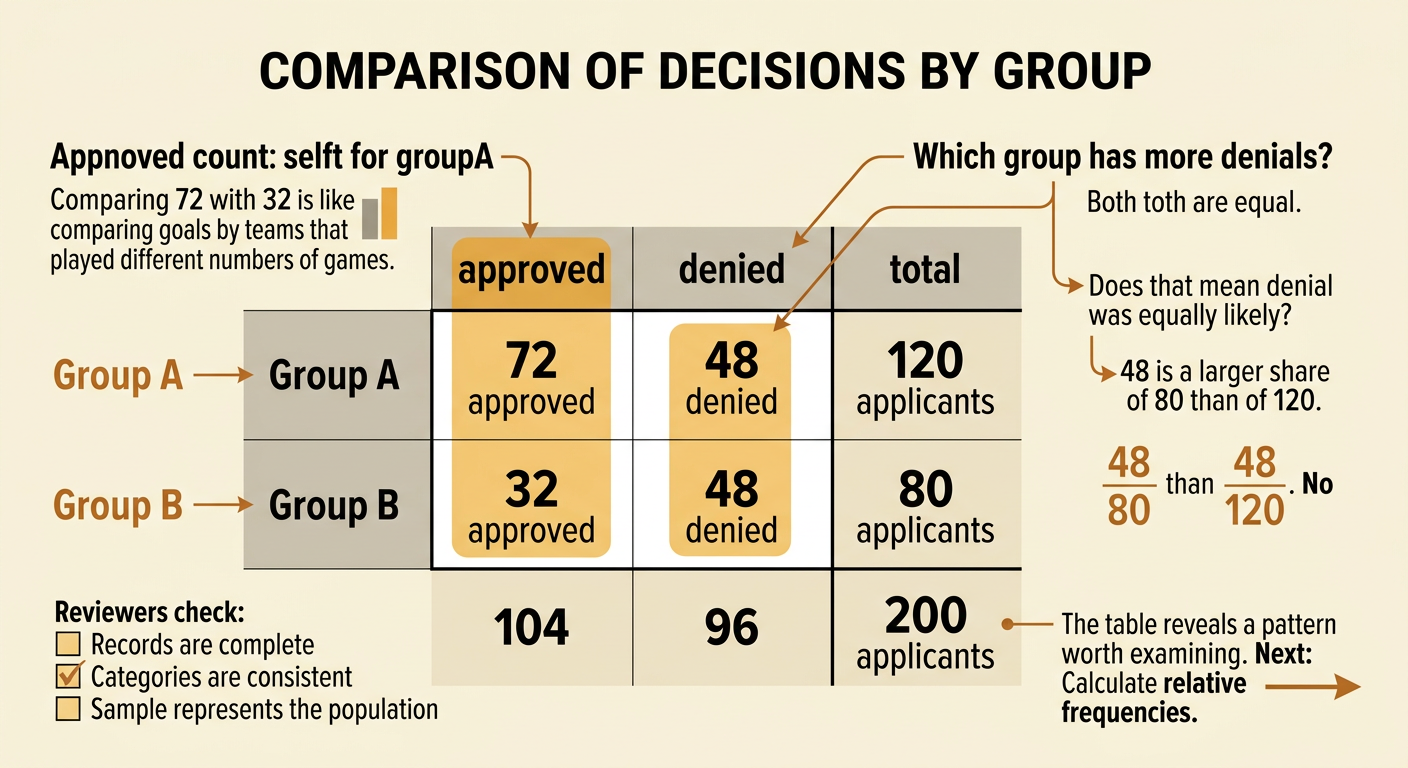
To review outcomes by group, organize the algorithm’s decisions in a two-way table. One category can represent group membership, and the other can represent the decision outcome. Suppose an algorithm evaluates 200 applicants. Group A has 120 applicants, with 72 approved and 48 denied. Group B has 80 applicants, with 32 approved and 48 denied. The table reveals that more people from Group A were approved, but raw counts alone do not show whether approval was equally likely because the groups have different sizes. Reviewers should also check whether the data are complete, whether group categories are defined consistently, and whether the sample represents the population affected by the system. Group comparisons can reveal patterns that deserve investigation, but they do not by themselves prove intentional discrimination or identify its cause.
Calculating Relative Frequencies
Relative frequency expresses a count as a proportion or percentage of a relevant total. To compare approval rates, divide each group’s approved count by that group’s total number of applicants. Group A’s approval rate is 72 divided by 120, or 0.60, which equals 60 percent. Group B’s rate is 32 divided by 80, or 0.40, which equals 40 percent. The difference is 20 percentage points. Another comparison is the rate ratio: 40 percent divided by 60 percent is about 0.67, meaning Group B’s approval rate is about 67 percent of Group A’s rate. Always identify the denominator because dividing by all 200 applicants would answer a different question. Relative frequencies make unequal-sized groups comparable and help identify possible associations between group membership and algorithmic outcomes.

Identifying Potential Bias
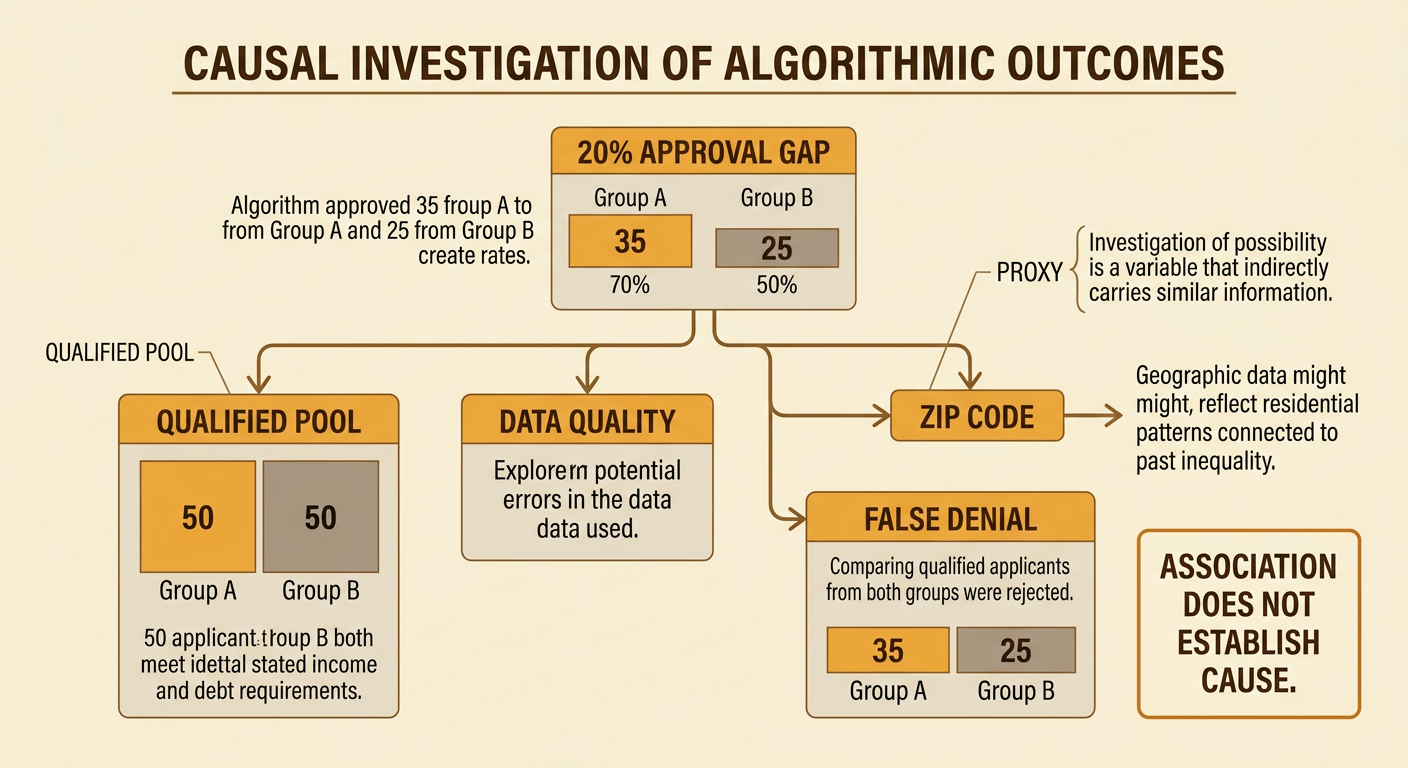
A difference in outcomes is evidence of a pattern, not automatic proof that an algorithm is biased. Investigators should ask whether groups differ in job-related or decision-related qualifications, whether the data contain errors, and whether an input acts as a proxy for a protected characteristic. For example, suppose 50 applicants from each group meet the same stated income and debt requirements. If the algorithm approves 35 applicants from Group A but only 25 from Group B, the rates are 70 percent and 50 percent. Reviewers might then examine whether ZIP code, school attended, or gaps in credit history influence scores unevenly. They should test alternative explanations and compare false approvals and false denials across groups. Bias can enter through historical data, selected variables, labels, thresholds, or deployment practices, so the entire system needs examination.
Evaluating Accuracy and Fairness Trade-Offs
Algorithm improvements should be evaluated using prioritized criteria rather than a single measure. Relevant criteria can include overall accuracy, subgroup error rates, equal access, privacy, cost, transparency, and consistency with law and institutional goals. Imagine that a current loan model correctly predicts repayment for 82 percent of applicants but has a 20-percentage-point approval gap. A revised model removes ZIP code, reaches 81 percent accuracy, and reduces the gap to 8 points. The revision loses one percentage point of overall accuracy while substantially narrowing the outcome difference. However, overall accuracy can hide unequal false-denial rates, so evaluators must inspect results for each group. They should also consider the consequences of errors: denying a qualified applicant may restrict opportunity, while approving an applicant who cannot repay may create financial harm. The best choice depends on openly justified priorities and evidence.

Recommending Algorithm Improvements
A strong recommendation identifies specific changes, explains the evidence supporting them, and includes a plan for monitoring results. For the loan example, a review team might recommend removing ZIP code, retraining the model with more representative data, checking approval and error rates by group, and requiring human review for scores near the threshold. The institution could also provide understandable decision explanations and an appeal process for applicants who believe their information is wrong. Suppose these changes reduce the approval gap from 20 to 8 percentage points while accuracy decreases from 82 to 81 percent. The team could prioritize the smaller gap because the accuracy loss is limited, then audit the system every six months. Public reporting, regulatory oversight, citizen complaints, and institutional policies can shape whether the system gains trust, changes behavior, or reproduces inequality. Recommendations should assign responsibility and define measurable success criteria.
