
Evaluating Climate Policy Through Evidence and Civic Reasoning
Students analyze scientific findings, quantitative data, and competing civic perspectives to evaluate a proposed climate policy and develop an evidence-based recommendation.

Illustrations are auto-generated and may be placeholders. They can be refreshed to match the narration.
Introducing the Policy Question
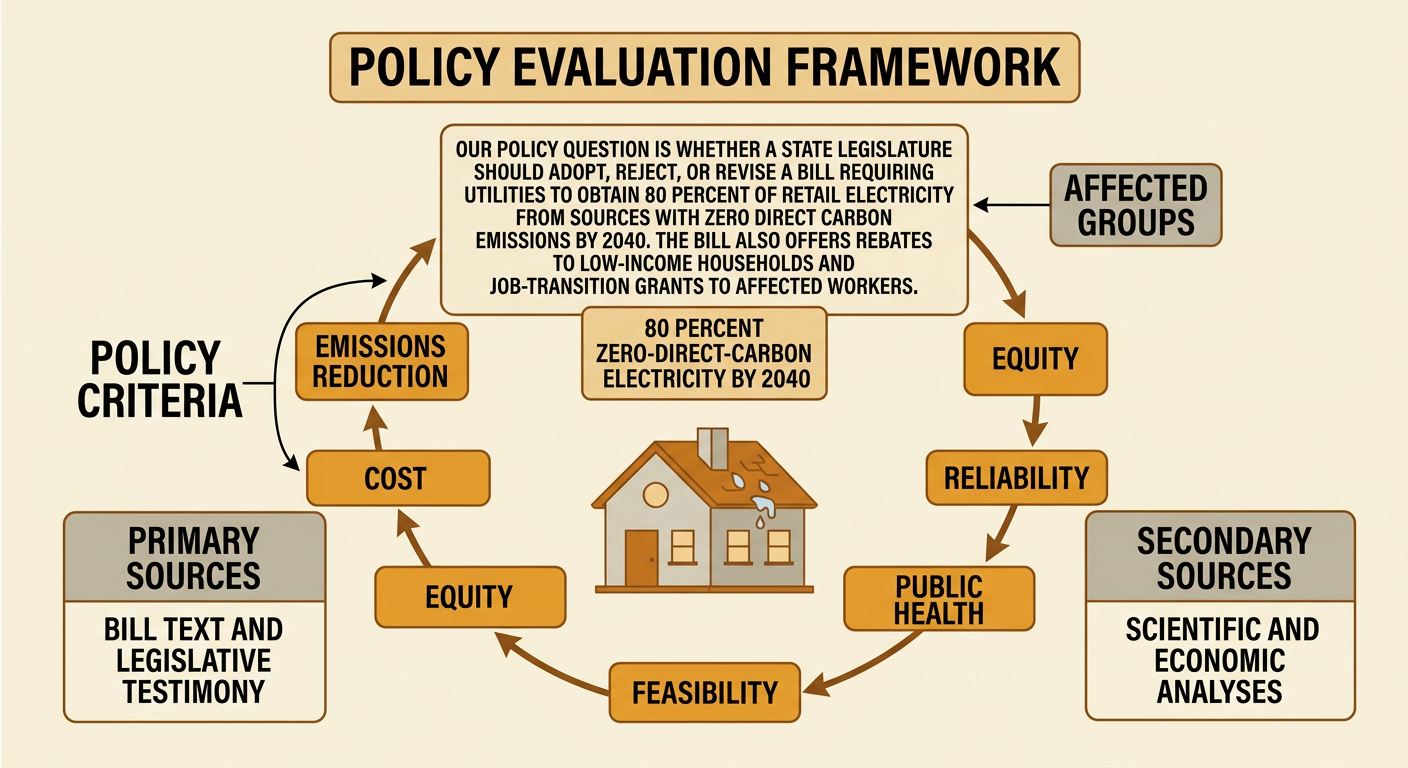
The class will examine a hypothetical state bill requiring utilities to obtain 80 percent of retail electricity from sources with zero direct carbon emissions by 2040. The bill also provides rebates for low-income households and job-transition grants for affected workers. Begin with a focused question: Should the legislature adopt, reject, or revise this policy? Identify the policy’s goals, affected groups, timeline, enforcement system, and funding source before judging it. Use the bill text and legislative testimony as primary sources and scientific or economic analyses as secondary sources. For example, a goal of reducing emissions does not by itself establish that the bill is effective or fair. Students should develop evaluation criteria such as emissions reduction, cost, reliability, feasibility, public health, and equity. These criteria make competing recommendations easier to compare and support with evidence.
Reviewing Climate Science Evidence
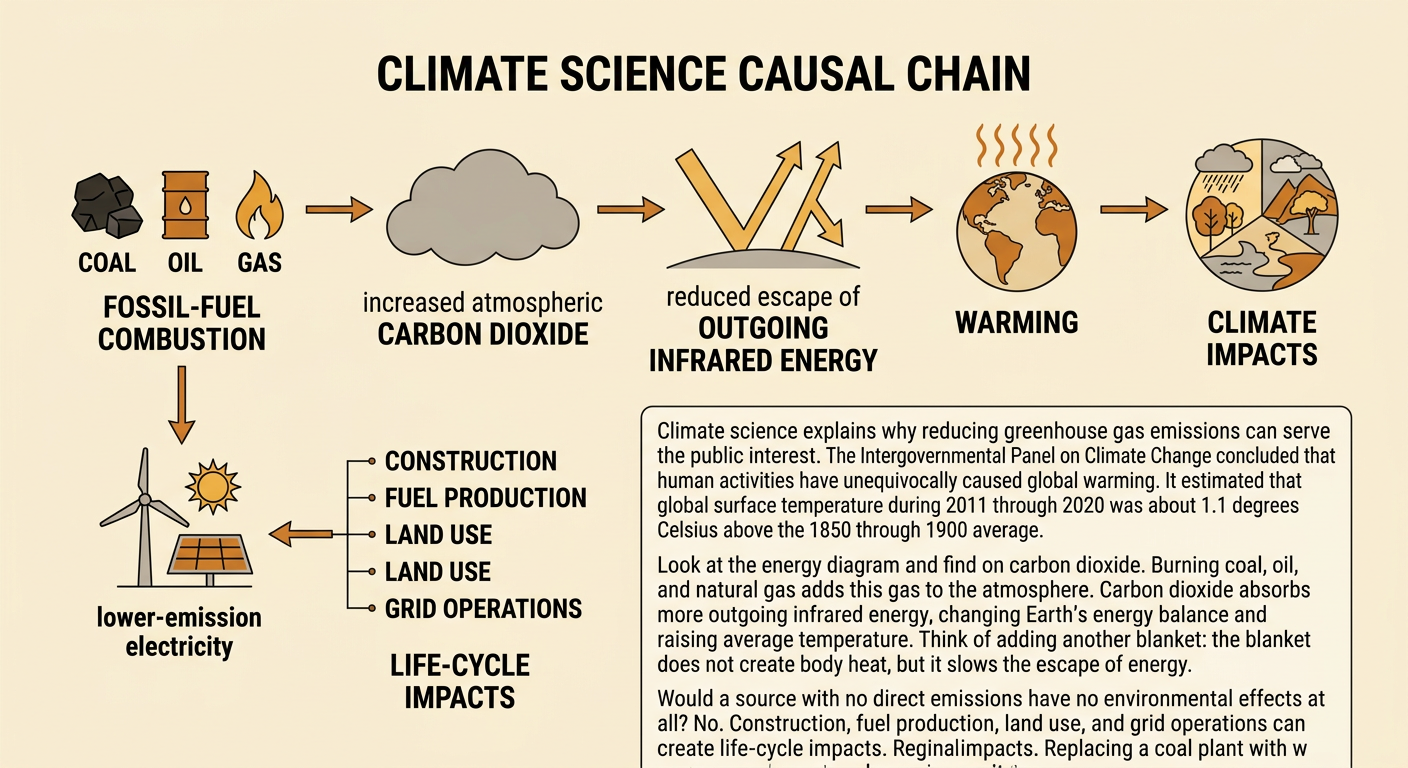
Climate evidence establishes why reducing greenhouse gas emissions may be a public goal. The Intergovernmental Panel on Climate Change concluded that human activities have unequivocally caused global warming and estimated that global surface temperature in 2011–2020 was about 1.1 degrees Celsius above the 1850–1900 average. Carbon dioxide released by burning coal, oil, and natural gas increases the atmosphere’s ability to absorb outgoing infrared energy. This changes Earth’s energy balance and raises average temperature. Electricity sources with no direct carbon dioxide emissions can reduce power-sector emissions, although construction, fuel production, land use, and grid operations may still create life-cycle impacts. For example, replacing a coal-fired plant with wind, solar, nuclear, storage, or a combination could lower direct emissions, but the actual reduction depends on which generators operate less. Cite the exact scientific finding and explain its relevance to the proposed policy.
Interpreting Economic and Emissions Data
Quantitative evidence should be represented accurately and interpreted cautiously. Consider an illustrative data set in which zero-direct-carbon electricity shares of 20, 30, 40, 50, and 60 percent correspond to annual power-sector emissions of 42, 38, 35, 29, and 25 million metric tons. A scatterplot shows a negative association. Using the first and last points gives an approximate slope of negative 0.43 million metric tons per percentage-point increase. However, association alone does not prove that the electricity share caused the entire decline; weather, demand, efficiency, and plant closures may also matter. Economic projections require similar care. If an analysis estimates $900 million in annual compliance costs and $1.3 billion in annual health and climate benefits, compare the time period, assumptions, uncertainty, and who pays or benefits. A statewide net benefit can still include substantial costs for particular households, workers, or communities.

Comparing Stakeholder Perspectives
Stakeholders often agree on some facts while disagreeing about risk, fairness, or acceptable government action. Compare each perspective by identifying its claim, supporting evidence, interests, and civic principles. In a hypothetical hearing, a utility might support gradual targets but warn that rapid retirement of dispatchable plants could threaten reliability during peak demand. A low-income consumer group might favor emissions reductions while requesting larger rebates to prevent energy burdens. Labor representatives might seek wage standards and transition assistance, while renewable-energy businesses might emphasize investment and job growth. Communities near power plants may cite health benefits from reduced air pollution, whereas communities near proposed transmission lines may raise land and cultural-resource concerns. Do not treat every statement as equally reliable. Check whether testimony uses verifiable data, represents broad or narrow interests, acknowledges uncertainty, and directly addresses the bill’s provisions.
Evaluating Policy Trade-Offs
Policy evaluation requires weighing intended outcomes against unintended outcomes and then considering possible revisions. Intended results of the bill include lower greenhouse gas emissions, cleaner air, technological investment, and progress toward a long-term target. Possible unintended results include higher short-term rates, reliability problems if replacement resources are delayed, job losses in fossil-fuel communities, or conflicts over land and transmission siting. These outcomes connect to civic principles such as the common good, individual rights, equal protection, procedural fairness, and government accountability. For example, a uniform electricity-rate increase may appear neutral but place a greater burden on households with low incomes. The legislature could refine the policy by adding targeted rebates, worker-transition funding, regular reliability reviews, transparent progress reports, and environmental and cultural safeguards for project siting. A strong evaluation explains which trade-offs are acceptable, which require mitigation, and which could justify changing the target or timeline.

Writing an Evidence-Based Recommendation
Write a recommendation that states a clear position, cites specific evidence, explains reasoning, addresses a counterclaim, and proposes action. Distinguish measured findings from projections and cite the source of every important statistic or quotation. A sample position might be: The legislature should adopt the 80 percent requirement with stronger household rebates, worker assistance, and scheduled reliability reviews. Support this claim with climate findings, the emissions trend, cost and benefit estimates, and relevant testimony. Then connect each source to the judgment. For example, the negative emissions association supports the policy’s likely direction, but it does not prove the projected reduction; therefore, transparent monitoring is necessary. Address a counterclaim by acknowledging that new infrastructure could raise short-term costs, then evaluate whether rebates and phased implementation adequately reduce that harm. End with measurable conditions for reviewing the policy, such as emissions, rates, outages, employment, and household energy burdens.
