
Evaluating Energy Resource Tradeoffs
Students compare renewable and nonrenewable energy resources using evidence about availability, cost, reliability, and environmental effects to recommend an energy strategy for a community.

Illustrations are auto-generated and may be placeholders. They can be refreshed to match the narration.
Community Energy Challenge
Communities need energy for homes, schools, transportation, hospitals, and businesses. Choosing an energy strategy is a design challenge because no resource performs best in every category. Decision makers must define the community’s needs, identify realistic options, and compare evidence about availability, cost, reliability, and environmental effects. For example, imagine a town that needs enough electricity to meet a peak demand of 100 megawatts. The town could expand a natural gas plant, install solar panels, purchase wind energy, reduce demand through efficiency, or combine several approaches. Local conditions matter: strong sunlight supports solar power, while existing pipelines may make natural gas easier to use. A fair evaluation also establishes constraints, such as a limited budget, air-quality goals, land availability, and the requirement to keep electricity available at all hours.

Renewable and Nonrenewable Resources
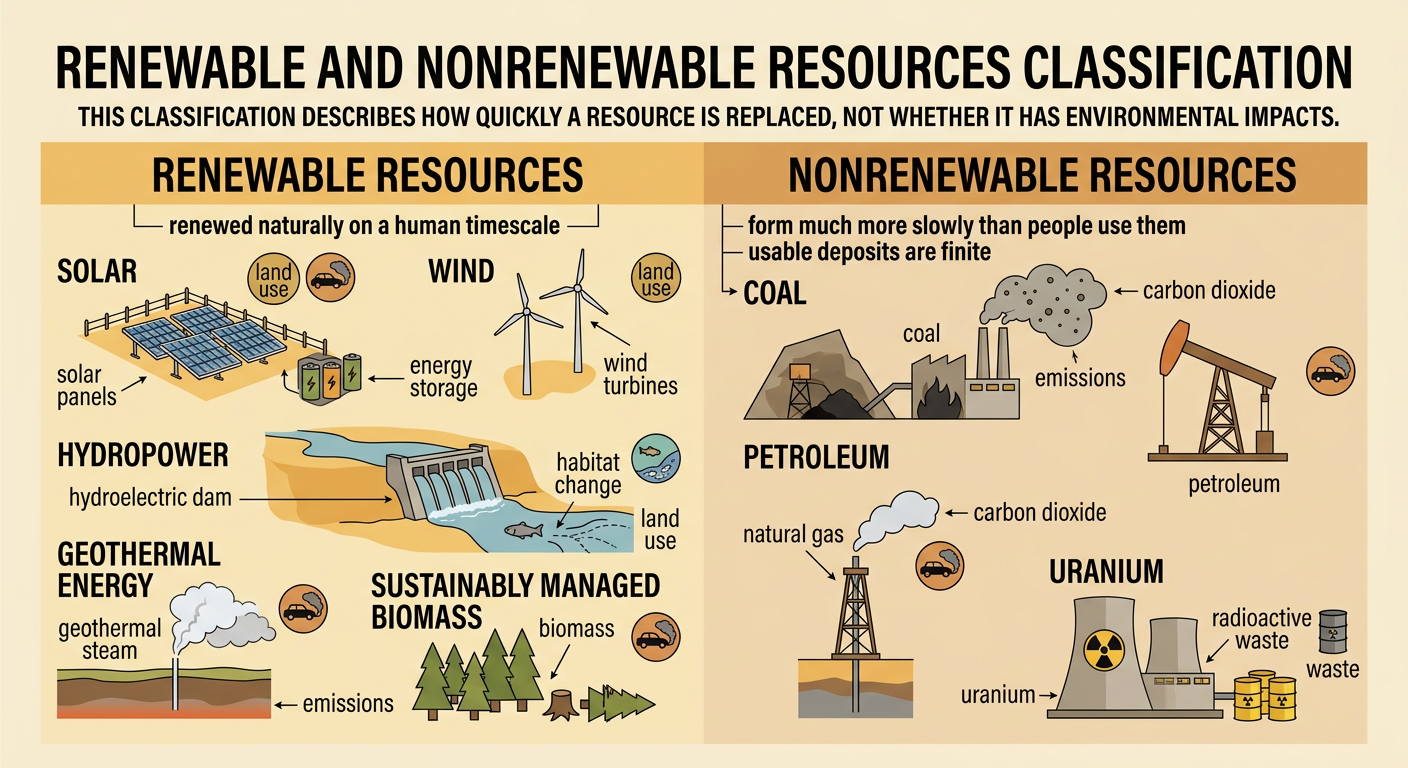
Renewable resources are replenished naturally on a human timescale, while nonrenewable resources form much more slowly than people use them. Solar, wind, hydropower, geothermal energy, and sustainably managed biomass are renewable. Coal, petroleum, natural gas, and uranium are nonrenewable because their usable deposits are finite. Renewable does not mean impact-free. A wind farm requires land and materials, a dam changes river habitats, and biomass can release air pollutants. Nonrenewable resources also differ from one another. Burning coal generally releases more carbon dioxide per unit of electricity than burning natural gas, while nuclear fission produces very low operational carbon emissions but creates radioactive waste requiring secure management. For example, a sunny community may have abundant solar energy during the day, yet it may still need storage, transmission connections, or another source to provide electricity after sunset.
Interpreting Cost and Impact Data
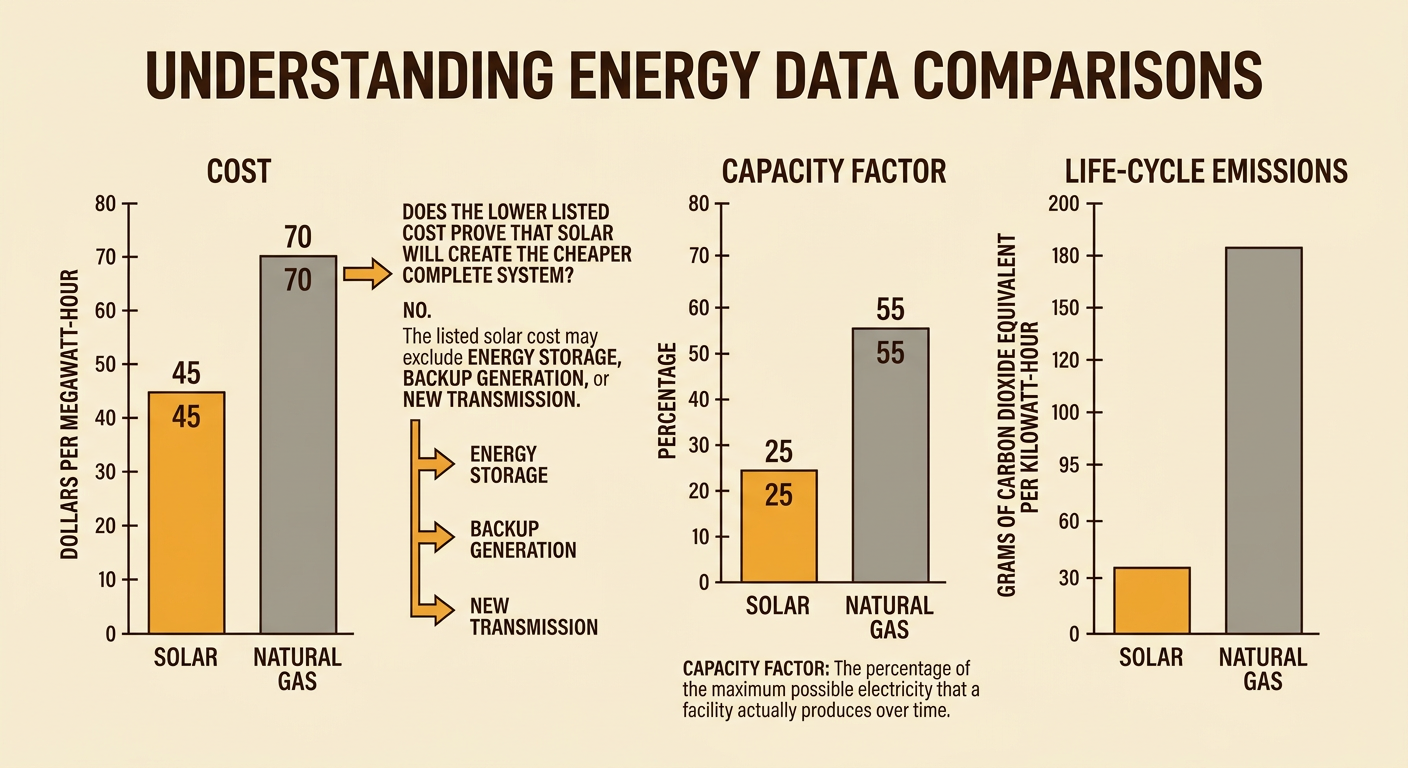
Energy decisions depend on quantitative data, but the units and graph scales must be read carefully. Cost is often compared as dollars per megawatt-hour, while greenhouse gas effects may be reported as grams of carbon dioxide equivalent per kilowatt-hour over the resource’s life cycle. Reliability data can include capacity factor, which is the percentage of maximum possible electricity actually produced over time. Suppose a table shows solar at $45 per megawatt-hour with a 25 percent capacity factor and natural gas at $70 per megawatt-hour with a 55 percent capacity factor. Solar has the lower listed generation cost, but that fact alone does not show the cost of storage or backup electricity. To translate the table into a visual, students can create aligned bar graphs for cost, capacity factor, and emissions. In words, they should identify the pattern and explain important limitations rather than simply naming the shortest bar.
Comparing Benefits and Tradeoffs
A tradeoff occurs when gaining one benefit requires accepting a cost or giving up another benefit. Students can compare options with a decision matrix, but they should support every score with evidence. Economic costs include construction, fuel, operation, transmission, and decommissioning. Benefits may include dependable electricity, local jobs, lower emissions, and stable long-term prices. Marginal cost is the additional cost of one more unit or step, while marginal benefit is the additional gain from it. For example, adding the first battery to a solar system may prevent frequent evening shortages. Adding another identical battery may provide a smaller benefit if shortages have already become rare. The community should continue an action when its marginal benefit is greater than its marginal cost, while also considering effects that market prices may omit, such as public health, climate risks, habitat loss, or unequal burdens on nearby neighborhoods.

Evidence-Based Energy Recommendation
A strong recommendation makes a clear claim, supports it with relevant evidence, and explains why the benefits outweigh the costs under the community’s constraints. It should also acknowledge uncertainty and the strongest disadvantage of the preferred strategy. For example, a student might recommend meeting new demand with 50 percent solar power, 20 percent wind power, 20 percent energy efficiency, and 10 percent dispatchable generation or storage. The student could cite local sunlight and wind data, estimated costs, emissions information, and hourly demand patterns. The reasoning should explain how a diverse mix reduces dependence on one resource and how efficiency can lower the amount of new generation required. The recommendation should not claim that the plan has no impacts. Instead, it could propose monitoring reliability, protecting sensitive habitats, and reviewing costs each year. Comparing this plan with a realistic alternative makes the argument testable, transparent, and useful to decision makers.
