
Evaluating Statistical Claims in Data-Based Reports
Students analyze a real-world report to determine whether its data, sampling method, and study design adequately support its conclusions.

Illustrations are auto-generated and may be placeholders. They can be refreshed to match the narration.
Identify the Report’s Claim
Begin by stating exactly what the report claims and identifying the evidence offered for it. Separate the numerical result from the interpretation. Suppose a report compares 600 seniors at six high schools. Students at schools beginning at 8:45 a.m. earned an average math score of 78, while students at schools beginning at 7:30 a.m. averaged 72. The numerical result is a six-point difference between the groups. The report’s stronger claim might be, “Starting school later raises math scores by six points.” That wording claims a cause-and-effect relationship, not merely an association. Also check whether the claim concerns the sampled seniors, all students in the district, or all U.S. high school students. A precise restatement reveals what the data would need to support.

Examine the Sample and Population
The population is the full group the report intends to describe, while the sample is the smaller group actually studied. Ask how participants were selected and whether they reasonably represent the population. In the school-start report, the sample includes 600 seniors from six suburban schools chosen because their records were readily available. If the conclusion refers to all U.S. high school students, the sample may not represent students from rural schools, urban schools, private schools, or other grade levels. This is undercoverage. A large sample does not automatically fix an unrepresentative selection process. Random sampling from a clearly defined population generally supports broader generalization better than convenience sampling. Also inspect response rates, exclusions, and group sizes because missing or excluded students may differ systematically from those included.

Distinguish Observation from Experiment
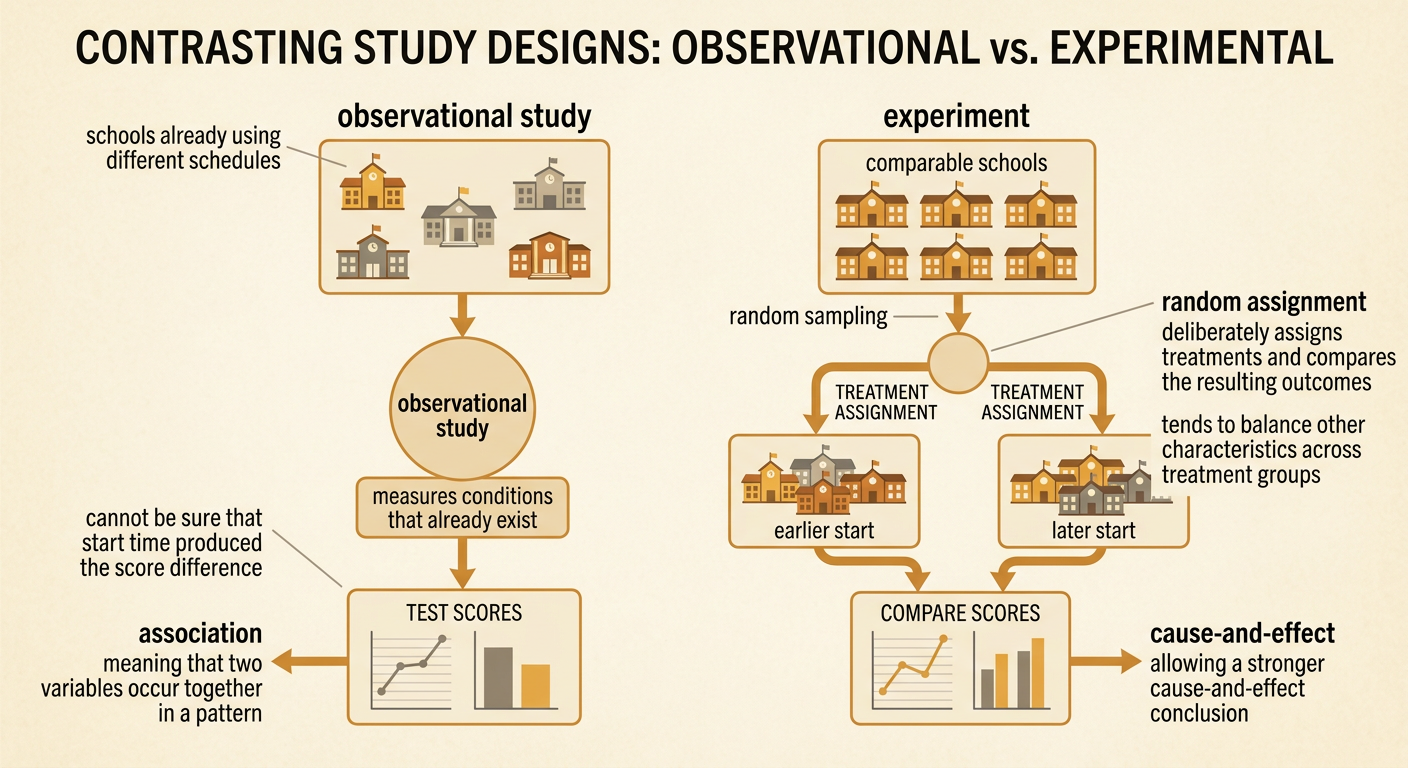
An observational study measures existing conditions without assigning treatments. An experiment deliberately assigns treatments, ideally using random assignment, and then compares outcomes. In the example, researchers observed schools that already used either an 8:45 a.m. or 7:30 a.m. start time. Because researchers did not assign schedules, the study is observational. It can show an association between start time and math scores, but it cannot by itself establish that the schedule caused the difference. A stronger experiment might randomly assign many comparable schools to adopt either a later or earlier start, then measure scores under consistent conditions. Random assignment tends to balance other characteristics across groups. Do not confuse random sampling with random assignment: sampling supports generalization to a population, while assignment supports cause-and-effect conclusions.
Check for Bias and Confounding
Bias is a systematic feature of data collection that favors some outcomes or groups. Confounding occurs when another variable is related to both the explanatory variable and the response, making the relationship difficult to interpret. In the start-time report, later-start schools might also have smaller classes, more experienced teachers, higher family incomes, or stronger tutoring programs. Any of these factors could help explain the higher math scores. Selection bias may occur if schools volunteered because they expected favorable results. Nonresponse bias could arise if students with frequent absences were missing from the records. Measurement bias is possible if the schools used different math tests or testing conditions. Look for design features that reduce these problems, such as randomization, matching, consistent measurement, blinding when appropriate, and statistical adjustment for relevant variables.

Judge Whether the Conclusion Is Supported
Judge a conclusion by matching its strength to the study’s design, sample, measurements, and uncertainty. The six-point difference supports the statement that, among the sampled schools, seniors at later-start schools had higher average math scores. It does not adequately support the claim that later starts caused the increase or that every U.S. high school would obtain the same result. The study was observational, the schools formed a convenience sample, and several possible confounders were not controlled. Sampling variability should also be considered through measures such as margins of error or confidence intervals when appropriate. A defensible conclusion would be, “In these six schools, later start times were associated with higher average senior math scores; further randomized or carefully controlled research is needed to investigate causation.” Good evaluation does not simply accept or reject a report; it states precisely what the evidence supports.
